
Plotting Trainer, Jockey and Sire Statistics in a Stacked Bar Chart with R
By Phill Clarke on Saturday, June 23rd, 2018Earlier in the week we looked at how to use a for loop to iterate across rows of a dataframe to calculate statistics in an automated manner. Interesting and useful, but we only looked at one specific set of circumstance; trainer and jockey combinations in Group races. There are many other useful statistics which can be used to examine a race. This article focuses on today’s Diamond Jubilee Stakes at Royal Ascot, extends the one collection of statistics to four and finally plots the outcome in a visual format.
As the code examples for this article now extend to beyond 550 lines, it is not practicle to include all the code in-line with the article text. Therefore, only certain examples will be included in-line with the full R code will be provided at the end of the article.
The initial assumption is that data has been returned from the Smartform database, although some additional field are now returned, specifically trainer_id, jockey_id and sire_name.
# Select relevant historic results
sql1 <- paste("SELECT historic_races.course,
              historic_races.meeting_date,
              historic_races.conditions,
              historic_races.group_race,
              historic_races.race_type_id,
              historic_races.race_type,
              historic_races.distance_yards,
              historic_runners.name,
              historic_runners.jockey_name,
              historic_runners.trainer_name,
              historic_runners.finish_position,
              historic_runners.starting_price_decimal,
              historic_runners.trainer_id,
              historic_runners.jockey_id,
              historic_runners.sire_name
              FROM smartform.historic_runners
              JOIN smartform.historic_races USING (race_id)
              WHERE historic_races.meeting_date >= '2012-01-01'", sep="")
Previously we created a trainer & jockey function to investigate these specific combinations in Group races. This is now extended to just trainer, just jockey and just sire functions. The trainer function is found below.
# Trainer stats
# Name the function and add some arguments
tr <- function(race_filter = "", price_filter = 1000, trainer){

  # Filter for flat races only
  flat_races_only <- dplyr::filter(smartform_results,
                                   race_type_id == 12 |
                                     race_type_id == 15)

  # Add an if else statement for the race_filter argument
  if (race_filter == "group"){

    filtered_races <- dplyr::filter(flat_races_only,
                                    group_race == 1 |
                                      group_race == 2 |
                                      group_race == 3 )
  } else {

    filtered_races = flat_races_only
  }

  # Filter by trainer id
  trainer_filtered <- dplyr::filter(filtered_races,
                                    grepl(trainer, trainer_id))


  # Filter by price
  trainer_price_filtered <- dplyr::filter(trainer_filtered,
                                                 starting_price_decimal <= price_filter)

  #  Calculate Profit and Loss
  trainer_cumulative <- cumsum(
    ifelse(trainer_price_filtered$finish_position == 1,
           (trainer_price_filtered$starting_price_decimal-1),
           -1)
  )

  # Calculate Strike Rate
  winners <- nrow(dplyr::filter(trainer_price_filtered,
                                finish_position == 1))

  runners <- nrow(trainer_price_filtered)

  strike_rate <- (winners / runners) * 100

  # Calculate Profit on Turnover or Yield
  profit_on_turnover <- (tail(trainer_cumulative, n=1) / runners) * 100

  # Check if POT is zero length to catch later errors
  if (length(profit_on_turnover) == 0) profit_on_turnover <- 0

  # Calculate Impact Values
  # First filter all runners by price, to return those just starting at the price_filter or less
  all_runners <- nrow(dplyr::filter(filtered_races,
                                    starting_price_decimal <= price_filter))

  # Filter all winners by the price filter
  all_winners <- nrow(dplyr::filter(filtered_races,
                                    finish_position == 1 &
                                      starting_price_decimal <= price_filter))

  # Now calculate the Impact Value
  iv <- (winners / all_winners) / (runners / all_runners)

  # Calculate Actual vs Expected ratio
  # # Convert all decimal odds to probabilities
  total_sp <- sum(1/trainer_price_filtered$starting_price_decimal)

  # Calculate A/E by dividing the number of  winners, by the sum of all SP probabilities.
  ae <- winners / total_sp

  # Calculate Archie
  archie <- (runners * (winners  - total_sp)^2)/ (total_sp  * (runners - total_sp))

  # Calculate the Confidence figure
  conf <- pchisq(archie, df = 1)*100

  # Create an empty variable
  trainer <- NULL

  # Add all calculated figures as named objects to the variable, which creates a list
  trainer$tr_runners <- runners
  trainer$tr_winners <- winners
  trainer$tr_sr <- strike_rate
  trainer$tr_pot <- profit_on_turnover
  trainer$tr_iv <- iv
  trainer$tr_ae <- ae
  trainer$tr_conf <- conf

  # Add an error check to convert all NaN values to zero
  final_results <- unlist(trainer)
  final_results[ is.nan(final_results) ] <- 0

  # Manipulate the layout of returned results to be a nice dataframe
  final_results <- t(as.data.frame(final_results))
  rownames(final_results) <- c()

  # 2 decimal places only
  round(final_results, 2)

  # Finally, close the function
}
Note that in the above code, instead of filtering by trainer_name, we are now filtering by trainer_id. This is due to the fact that sometimes the trainer names in the daily racing data do not exactly match those in the historic data. For example, Sir Michael Stoute hasn’t always been a knight. Therefore, if we were just matching on trainer_name there would be some occassions where this fails and no results are returned. Smartform instead provides a unique identification number for trainers and jockeys, which insures there will always be a match between historic and daily data.
The function above is just one example. In order to produce the charts later in this article, additional jockey and sire functions have been added, bringing the total to four; trainer, jockey, trainer & jockey and sire. The number of statistics could be extended much further to include angles such as trainer & distance, trainer & course, trainer & age (2yo, 3yo, 4yo+ races) and many more.
The for loop also now includes all four of these functions.
# Create placeholder lists which will be required later
row_tr <- list()
row_jc <- list()
row_tj <- list()
row_sr <- list()

# Setup the loop
# For each horse in the group_races_only dataframe
for (i in group_races_only$name) {


  runner_details = group_races_only[group_races_only$name==i,]

  # Extract trainer, jockey id and sire names
  trainer <- runner_details$trainer_id
  jockey <- runner_details$jockey_id
  sire <- runner_details$sire_name

  # Apply the Trainer function for Group races only
  trainer_combo <- tr(race_filter = "group",
                                  trainer = trainer)

  # Add results row by row to the previously defined list
  row_tr[[i]] <- trainer_combo

  # Apply the Jockey function for Group races only
  jockey_combo <- jc(race_filter = "group",
                             jockey = jockey)

  # Add results row by row to the previously defined list
  row_jc[[i]] <- jockey_combo

  # Apply the Trainer/Jockey function for Group races only
  trainer_jockey_combo <- tj(race_filter = "group",
                             trainer = trainer, jockey = jockey)

  # Add results row by row to the previously defined list
  row_tj[[i]] <- trainer_jockey_combo

  # Apply the Sire function for Group races only
  sire_combo <- sr(race_filter = "group",
                             sire = sire)

  # Add results row by row to the previously defined list
  row_sr[[i]] <- sire_combo

  # Create a final dataframe
  stats_final_tr <- as.data.frame(do.call("rbind", row_tr))
  stats_final_jc <- as.data.frame(do.call("rbind", row_jc))
  stats_final_tj <- as.data.frame(do.call("rbind", row_tj))
  stats_final_sr <- as.data.frame(do.call("rbind", row_sr))

}

# Create a new variable called racecard. Bind together the generic race details with the newly created stats
racecard <- cbind(group_races_only,stats_final_tr)
racecard <- cbind(racecard,stats_final_jc)
racecard <- cbind(racecard,stats_final_tj)
racecard <- cbind(racecard,stats_final_sr)
Viewing the final racecard now shows forty columns and a wall of data. This isn’t perhaps the easiest way to visualise the overall picture. Instead, we’ll create a stacked barchart showing Impact Values for all four angles. The legend shows tr_iv, jc_iv, tj_iv and sr_iv for the trainer, jockey, trainer & jockey and sire impact values.
# Filter for Diamond Jubilee Only
diamond_jubilee <- dplyr::filter(racecard,
                                 grepl("Diamond Jubilee",
                                       race_title))

# Filter for just the IV columns which we will plot
racecard_filtered_iv <- diamond_jubilee[,c("name","tr_iv","jc_iv", "tj_iv", "sr_iv")]

# Convert the racecard from wide to long format
racecard_long_iv <- melt(racecard_filtered_iv, id.var="name")

# Plot a stacked barchart
ggplot(racecard_long_iv, aes(x = name, y = value, fill = variable)) +
  geom_bar(stat = "identity") +
  theme(axis.text.x = element_text(angle = 45, hjust = 1))
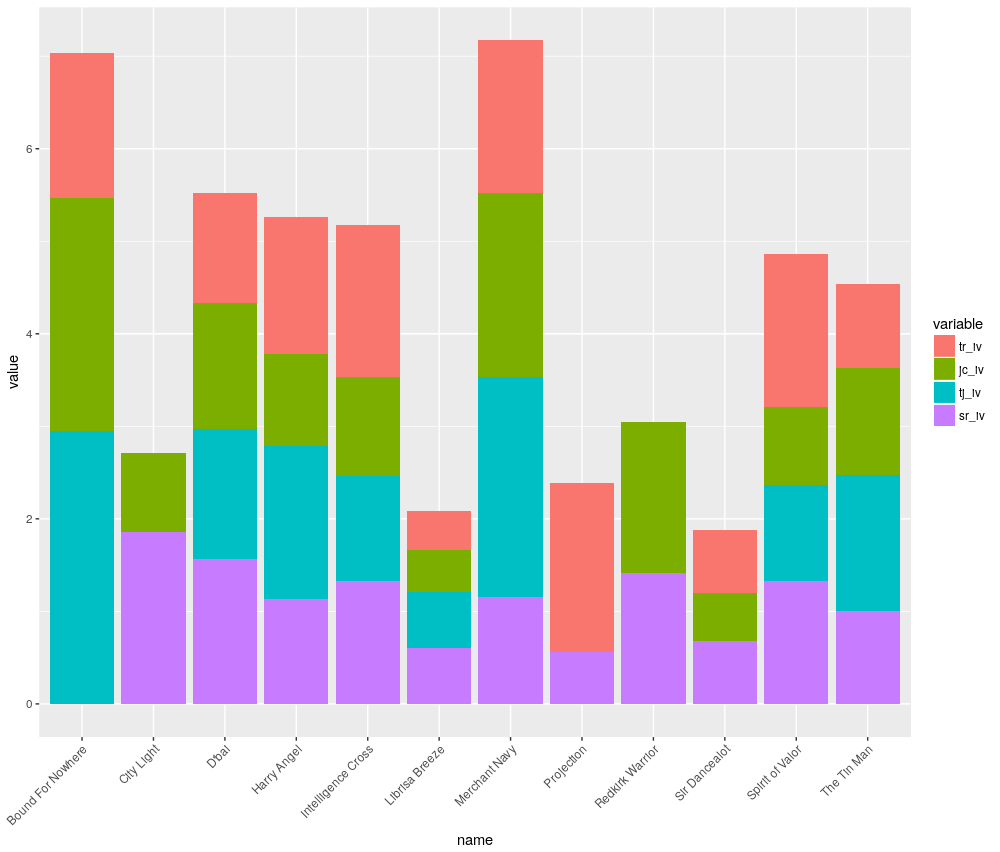
The highest bars indicate the highest cumulative Impact Values. Some bars do not include all four factors, as sometimes there were no results returned. For example, Bound For Nowhere’s sire, The Factor, has only had one Group runner in the UK & Ireland, which did not win. Therefore, there is no data to calculate strike rate, impact value etc.
This means one needs to be careful examining the chart and also take time to ponder the data in the dataframe. Some sample sizes may be very small and a question should be asked if they are statistically relevant. Bound For Nowhere’s Trainer & Jockey Impact Value is the highest in the race, but this is from only six runners. Compared to Merchant Navy with the second highest tj_iv, but from 357 runners.
Nonetheless, a visual method like this can still assist to narrow the field. Harry Angel, the favourite for the race, is certainly not a standout in the chart, with decent sample sizes across all four factors.
The stacked barchart can also be applied to Actual vs Expected figures, strike rates or Confidence figures. The chart below displays stacked A/E for a more value oriented view.
# Filter for just the AE columns which we will plot
racecard_filtered_ae <- diamond_jubilee[,c("name","tr_ae","jc_ae", "tj_ae", "sr_ae")]

# Convert the racecard from wide to long format
racecard_long_ae <- melt(racecard_filtered_ae, id.var="name")

# Plot a stacked barchart
ggplot(racecard_long_ae, aes(x = name, y = value, fill = variable)) +
  geom_bar(stat = "identity") +
  theme(axis.text.x = element_text(angle = 45, hjust = 1))
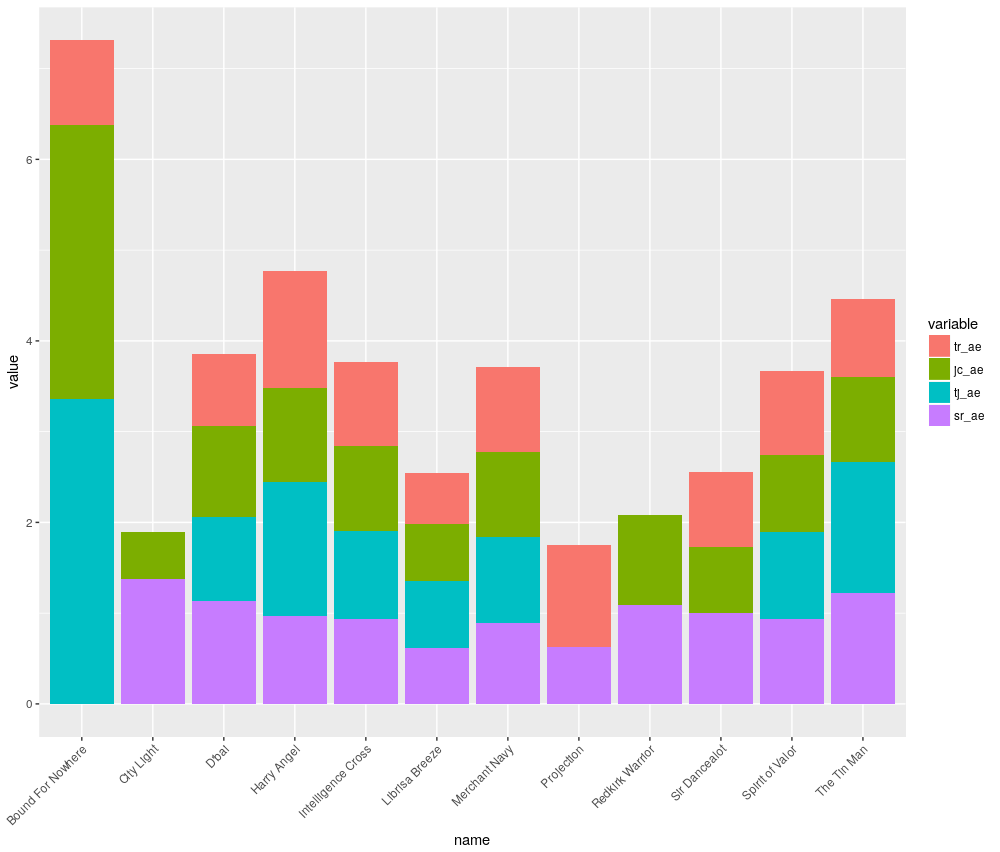
Once again, keep Bound for Nowhere’s small sample sizes in mind. Harry Angel appears to be a better betting proposition based on this chart.
Another way to look at this data might be as a grouped bar chart, where the IV and A/E figures are plotted for each horse next to each other.
# Filter for just the AE columns which we will plot
racecard_filtered_all <- diamond_jubilee[,c("name","tr_iv","jc_iv", "tj_iv", "sr_iv",
                                            "tr_ae","jc_ae", "tj_ae", "sr_ae")]

# Convert the racecard from wide to long format
racecard_long_all <- melt(racecard_filtered_all, id.var="name")

# Plot a grouped barchart
ggplot(racecard_long_all, aes(x = name, y = value, fill = variable)) +
  geom_bar(position = "dodge", stat="identity") +
  theme(axis.text.x = element_text(angle = 45, hjust = 1))
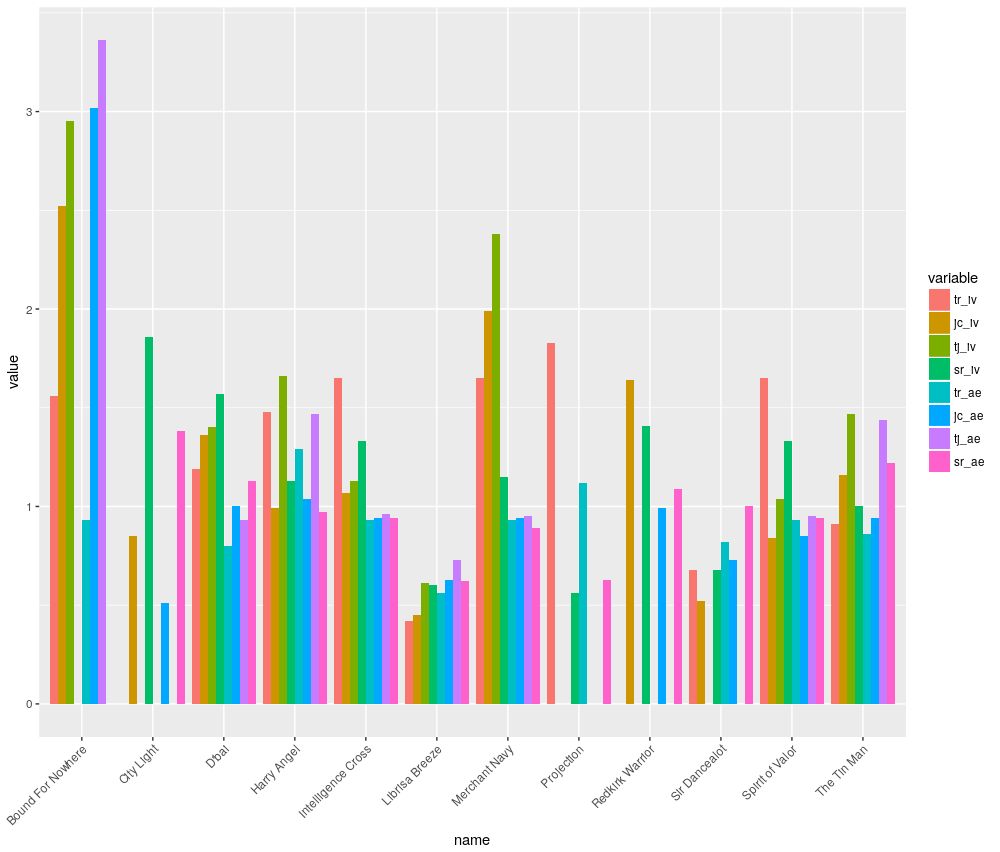
Although Sire IV is missing for Bound for Nowhere, his other figures do all point to a superier trainer and jockey, albeit from small sample size. How to statistically deal with these small sample sizes will be covered in a future article on Bayesian techniques.
Which horses might be included in a shortlist for today’s Diamond Jubilee? Even with small sample sizes, but knowing Wesley Ward’s Ascot success with sprinters, it may be wise to include Bound for Nowhere, who is currently 14.0 on Betfair. Merchant Navy (IV) and Harry Angel (A/E) are both positives, although much shorter priced at the top of the market.
It is important not to just rely on the data. There are many different factors to consider and a good knowledge of general form is also required. Therefore, after all that work, one might still decide just to back the Aussie danger and triple Group 1 sprint winner, Redkirk Warrior.
Good luck!
Questions and queries about this article should be posted as a comment below or on the Betwise Q&A board.
The full R code used in this article is found below.
# Load the library packages
library("RMySQL")
library("dplyr")
library("reshape2")
library("ggplot2")

# Connect to the Smartform database. Substitute the placeholder credentials for your own.
# The IP address can be substituted for a remote location if appropriate.
con <- dbConnect(MySQL(),
                 host='127.0.0.1',
                 user='yourusername',
                 password='yourpassword',
                 dbname='smartform')

# Select relevant historic results
sql1 <- paste("SELECT historic_races.course,
              historic_races.meeting_date,
              historic_races.conditions,
              historic_races.group_race,
              historic_races.race_type_id,
              historic_races.race_type,
              historic_races.distance_yards,
              historic_runners.name,
              historic_runners.jockey_name,
              historic_runners.trainer_name,
              historic_runners.finish_position,
              historic_runners.starting_price_decimal,
              historic_runners.trainer_id,
              historic_runners.jockey_id,
              historic_runners.sire_name
              FROM smartform.historic_runners
              JOIN smartform.historic_races USING (race_id)
              WHERE historic_races.meeting_date >= '2012-01-01'", sep="")

smartform_results <- dbGetQuery(con, sql1)

# Remove non-runners and non-finishers
smartform_results <- dplyr::filter(smartform_results, !is.na(finish_position))

# Select relevant daily results for tomorrow
sql2 <- paste("SELECT daily_races.course,
              daily_races.race_title,
              daily_races.meeting_date,
              daily_races.distance_yards,
              daily_runners.cloth_number,
              daily_runners.name,
              daily_runners.trainer_name,
              daily_runners.jockey_name,
              daily_runners.sire_name,
              daily_runners.forecast_price_decimal,
              daily_runners.trainer_id,
              daily_runners.jockey_id
              FROM smartform.daily_races
              JOIN smartform.daily_runners USING (race_id)
              WHERE daily_races.meeting_date >='2018-06-23'", sep="")

smartform_daily_results <- dbGetQuery(con, sql2)

dbDisconnect(con)

# Remove non-runners
smartform_daily_results <- dplyr::filter(smartform_daily_results, !is.na(forecast_price_decimal))

# Trainer stats
# Name the function and add some arguments
tr <- function(race_filter = "", price_filter = 1000, trainer){

  # Filter for flat races only
  flat_races_only <- dplyr::filter(smartform_results,
                                   race_type_id == 12 |
                                     race_type_id == 15)

  # Add an if else statement for the race_filter argument
  if (race_filter == "group"){

    filtered_races <- dplyr::filter(flat_races_only,
                                    group_race == 1 |
                                      group_race == 2 |
                                      group_race == 3 )
  } else {

    filtered_races = flat_races_only
  }

  # Filter by trainer name
  trainer_filtered <- dplyr::filter(filtered_races,
                                    grepl(trainer, trainer_id))


  # Filter by price
  trainer_price_filtered <- dplyr::filter(trainer_filtered,
                                                 starting_price_decimal <= price_filter)

  #  Calculate Profit and Loss
  trainer_cumulative <- cumsum(
    ifelse(trainer_price_filtered$finish_position == 1,
           (trainer_price_filtered$starting_price_decimal-1),
           -1)
  )

  # Calculate Strike Rate
  winners <- nrow(dplyr::filter(trainer_price_filtered,
                                finish_position == 1))

  runners <- nrow(trainer_price_filtered)

  strike_rate <- (winners / runners) * 100

  # Calculate Profit on Turnover or Yield
  profit_on_turnover <- (tail(trainer_cumulative, n=1) / runners) * 100

  # Check if POT is zero length to catch later errors
  if (length(profit_on_turnover) == 0) profit_on_turnover <- 0

  # Calculate Impact Values
  # First filter all runners by price, to return those just starting at the price_filter or less
  all_runners <- nrow(dplyr::filter(filtered_races,
                                    starting_price_decimal <= price_filter))

  # Filter all winners by the price filter
  all_winners <- nrow(dplyr::filter(filtered_races,
                                    finish_position == 1 &
                                      starting_price_decimal <= price_filter))

  # Now calculate the Impact Value
  iv <- (winners / all_winners) / (runners / all_runners)

  # Calculate Actual vs Expected ratio
  # # Convert all decimal odds to probabilities
  total_sp <- sum(1/trainer_price_filtered$starting_price_decimal)

  # Calculate A/E by dividing the number of  winners, by the sum of all SP probabilities.
  ae <- winners / total_sp

  # Calculate Archie
  archie <- (runners * (winners  - total_sp)^2)/ (total_sp  * (runners - total_sp))

  # Calculate the Confidence figure
  conf <- pchisq(archie, df = 1)*100

  # Create an empty variable
  trainer <- NULL

  # Add all calculated figures as named objects to the variable, which creates a list
  trainer$tr_runners <- runners
  trainer$tr_winners <- winners
  trainer$tr_sr <- strike_rate
  trainer$tr_pot <- profit_on_turnover
  trainer$tr_iv <- iv
  trainer$tr_ae <- ae
  trainer$tr_conf <- conf

  # Add an error check to convert all NaN values to zero
  final_results <- unlist(trainer)
  final_results[ is.nan(final_results) ] <- 0

  # Manipulate the layout of returned results to be a nice dataframe
  final_results <- t(as.data.frame(final_results))
  rownames(final_results) <- c()

  # 2 decimal places only
  round(final_results, 2)

  # Finally, close the function
}

# Jockey stats
# Name the function and add some arguments
jc <- function(race_filter = "", price_filter = 1000, jockey){

  # Filter for flat races only
  flat_races_only <- dplyr::filter(smartform_results,
                                   race_type_id == 12 |
                                     race_type_id == 15)

  # Add an if else statement for the race_filter argument
  if (race_filter == "group"){

    filtered_races <- dplyr::filter(flat_races_only,
                                    group_race == 1 |
                                      group_race == 2 |
                                      group_race == 3 )
  } else {

    filtered_races = flat_races_only
  }

  # Filter by trainer name
  jockey_filtered <- dplyr::filter(filtered_races,
                                    grepl(jockey, jockey_id))


  # Filter by price
  jockey_price_filtered <- dplyr::filter(jockey_filtered,
                                          starting_price_decimal <= price_filter)

  #  Calculate Profit and Loss
  jockey_cumulative <- cumsum(
    ifelse(jockey_price_filtered$finish_position == 1,
           (jockey_price_filtered$starting_price_decimal-1),
           -1)
  )

  # Calculate Strike Rate
  winners <- nrow(dplyr::filter(jockey_price_filtered,
                                finish_position == 1))

  runners <- nrow(jockey_price_filtered)

  strike_rate <- (winners / runners) * 100

  # Calculate Profit on Turnover or Yield
  profit_on_turnover <- (tail(jockey_cumulative, n=1) / runners) * 100

  # Check if POT is zero length to catch later errors
  if (length(profit_on_turnover) == 0) profit_on_turnover <- 0

  # Calculate Impact Values
  # First filter all runners by price, to return those just starting at the price_filter or less
  all_runners <- nrow(dplyr::filter(filtered_races,
                                    starting_price_decimal <= price_filter))

  # Filter all winners by the price filter
  all_winners <- nrow(dplyr::filter(filtered_races,
                                    finish_position == 1 &
                                      starting_price_decimal <= price_filter))

  # Now calculate the Impact Value
  iv <- (winners / all_winners) / (runners / all_runners)

  # Calculate Actual vs Expected ratio
  # # Convert all decimal odds to probabilities
  total_sp <- sum(1/jockey_price_filtered$starting_price_decimal)

  # Calculate A/E by dividing the number of  winners, by the sum of all SP probabilities.
  ae <- winners / total_sp

  # Calculate Archie
  archie <- (runners * (winners  - total_sp)^2)/ (total_sp  * (runners - total_sp))

  # Calculate the Confidence figure
  conf <- pchisq(archie, df = 1)*100

  # Create an empty variable
  jockey <- NULL

  # Add all calculated figures as named objects to the variable, which creates a list
  jockey$jc_runners <- runners
  jockey$jc_winners <- winners
  jockey$jc_sr <- strike_rate
  jockey$jc_pot <- profit_on_turnover
  jockey$jc_iv <- iv
  jockey$jc_ae <- ae
  jockey$jc_conf <- conf

  # Add an error check to convert all NaN values to zero
  final_results <- unlist(jockey)
  final_results[ is.nan(final_results) ] <- 0

  # Manipulate the layout of returned results to be a nice dataframe
  final_results <- t(as.data.frame(final_results))
  rownames(final_results) <- c()

  # 2 decimal places only
  round(final_results, 2)

  # Finally, close the function
}

# Trainer and Jockey stats
# Name the function and add some arguments
tj <- function(race_filter = "", price_filter = 1000, trainer, jockey){

  # Filter for flat races only
  flat_races_only <- dplyr::filter(smartform_results,
                                   race_type_id == 12 |
                                     race_type_id == 15)

  # Add an if else statement for the race_filter argument
  if (race_filter == "group"){

    filtered_races <- dplyr::filter(flat_races_only,
                                    group_race == 1 |
                                      group_race == 2 |
                                      group_race == 3 )
  } else {

    filtered_races = flat_races_only
  }

  # Filter by trainer name
  trainer_filtered <- dplyr::filter(filtered_races,
                                    grepl(trainer, trainer_id))

  # Remove non-runners
  #  trainer_name_filtered <- dplyr::filter(trainer_filtered, !is.na(finish_position))

  # Filter by jockey name
  trainer_jockey_filtered <- dplyr::filter(trainer_filtered,
                                           grepl(jockey, jockey_id))

  # Filter by price
  trainer_jockey_price_filtered <- dplyr::filter(trainer_jockey_filtered,
                                                 starting_price_decimal <= price_filter)

  #  Calculate Profit and Loss
  trainer_jockey_cumulative <- cumsum(
    ifelse(trainer_jockey_price_filtered$finish_position == 1,
           (trainer_jockey_price_filtered$starting_price_decimal-1),
           -1)
  )

  # Calculate Strike Rate
  winners <- nrow(dplyr::filter(trainer_jockey_price_filtered,
                                finish_position == 1))

  runners <- nrow(trainer_jockey_price_filtered)

  strike_rate <- (winners / runners) * 100

  # Calculate Profit on Turnover or Yield
  profit_on_turnover <- (tail(trainer_jockey_cumulative, n=1) / runners) * 100

  # Check if POT is zero length to catch later errors
  if (length(profit_on_turnover) == 0) profit_on_turnover <- 0

  # Calculate Impact Values
  # First filter all runners by price, to return those just starting at the price_filter or less
  all_runners <- nrow(dplyr::filter(filtered_races,
                                    starting_price_decimal <= price_filter))

  # Filter all winners by the price filter
  all_winners <- nrow(dplyr::filter(filtered_races,
                                    finish_position == 1 &
                                      starting_price_decimal <= price_filter))

  # Now calculate the Impact Value
  iv <- (winners / all_winners) / (runners / all_runners)

  # Calculate Actual vs Expected ratio
  # # Convert all decimal odds to probabilities
  total_sp <- sum(1/trainer_jockey_price_filtered$starting_price_decimal)

  # Calculate A/E by dividing the number of  winners, by the sum of all SP probabilities.
  ae <- winners / total_sp

  # Calculate Archie
  archie <- (runners * (winners  - total_sp)^2)/ (total_sp  * (runners - total_sp))

  # Calculate the Confidence figure
  conf <- pchisq(archie, df = 1)*100

  # Create an empty variable
  trainer_jockey <- NULL

  # Add all calculated figures as named objects to the variable, which creates a list
  trainer_jockey$tj_runners <- runners
  trainer_jockey$tj_winners <- winners
  trainer_jockey$tj_sr <- strike_rate
  trainer_jockey$tj_pot <- profit_on_turnover
  trainer_jockey$tj_iv <- iv
  trainer_jockey$tj_ae <- ae
  trainer_jockey$tj_conf <- conf

  # Add an error check to convert all NaN values to zero
  final_results <- unlist(trainer_jockey)
  final_results[ is.nan(final_results) ] <- 0

  # Manipulate the layout of returned results to be a nice dataframe
  final_results <- t(as.data.frame(final_results))
  rownames(final_results) <- c()

  # 2 decimal places only
  round(final_results, 2)

  # Finally, close the function
}

# Sire stats
# Name the function and add some arguments
sr <- function(race_filter = "", price_filter = 1000, sire){

  # Filter for flat races only
  flat_races_only <- dplyr::filter(smartform_results,
                                   race_type_id == 12 |
                                     race_type_id == 15)

  # Add an if else statement for the race_filter argument
  if (race_filter == "group"){

    filtered_races <- dplyr::filter(flat_races_only,
                                    group_race == 1 |
                                      group_race == 2 |
                                      group_race == 3 )
  } else {

    filtered_races = flat_races_only
  }

  # Filter by trainer name
  sire_filtered <- dplyr::filter(filtered_races,
                                    grepl(sire, sire_name))


  # Filter by price
  sire_price_filtered <- dplyr::filter(sire_filtered,
                                          starting_price_decimal <= price_filter)

  #  Calculate Profit and Loss
  sire_cumulative <- cumsum(
    ifelse(sire_price_filtered$finish_position == 1,
           (sire_price_filtered$starting_price_decimal-1),
           -1)
  )

  # Calculate Strike Rate
  winners <- nrow(dplyr::filter(sire_price_filtered,
                                finish_position == 1))

  runners <- nrow(sire_price_filtered)

  strike_rate <- (winners / runners) * 100

  # Calculate Profit on Turnover or Yield
  profit_on_turnover <- (tail(sire_cumulative, n=1) / runners) * 100

  # Check if POT is zero length to catch later errors
  if (length(profit_on_turnover) == 0) profit_on_turnover <- 0

  # Calculate Impact Values
  # First filter all runners by price, to return those just starting at the price_filter or less
  all_runners <- nrow(dplyr::filter(filtered_races,
                                    starting_price_decimal <= price_filter))

  # Filter all winners by the price filter
  all_winners <- nrow(dplyr::filter(filtered_races,
                                    finish_position == 1 &
                                      starting_price_decimal <= price_filter))

  # Now calculate the Impact Value
  iv <- (winners / all_winners) / (runners / all_runners)

  # Calculate Actual vs Expected ratio
  # # Convert all decimal odds to probabilities
  total_sp <- sum(1/sire_price_filtered$starting_price_decimal)

  # Calculate A/E by dividing the number of  winners, by the sum of all SP probabilities.
  ae <- winners / total_sp

  # Calculate Archie
  archie <- (runners * (winners  - total_sp)^2)/ (total_sp  * (runners - total_sp))

  # Calculate the Confidence figure
  conf <- pchisq(archie, df = 1)*100

  # Create an empty variable
  sire <- NULL

  # Add all calculated figures as named objects to the variable, which creates a list
  sire$sr_runners <- runners
  sire$sr_winners <- winners
  sire$sr_sr <- strike_rate
  sire$sr_pot <- profit_on_turnover
  sire$sr_iv <- iv
  sire$sr_ae <- ae
  sire$sr_conf <- conf

  # Add an error check to convert all NaN values to zero
  final_results <- unlist(sire)
  final_results[ is.nan(final_results) ] <- 0

  # Manipulate the layout of returned results to be a nice dataframe
  final_results <- t(as.data.frame(final_results))
  rownames(final_results) <- c()

  # 2 decimal places only
  round(final_results, 2)

  # Finally, close the function
}

# Filter tomorrow's races for Group races only
group_races_only <- dplyr::filter(smartform_daily_results,
                                  grepl(paste(c("Group 1", "Group 2", "Group 3"), collapse="|"), race_title))

# Create placeholder lists which will be required later
row_tr <- list()
row_jc <- list()
row_tj <- list()
row_sr <- list()

# Setup the loop
# For each horse in the group_races_only dataframe
for (i in group_races_only$name) {


  runner_details = group_races_only[group_races_only$name==i,]

  # Extract trainer and jockey names
  trainer <- runner_details$trainer_id
  jockey <- runner_details$jockey_id
  sire <- runner_details$sire_name

  # Apply the Trainer function for Group races only
  trainer_combo <- tr(race_filter = "group",
                                  trainer = trainer)

  # Add results row by row to the previously defined list
  row_tr[[i]] <- trainer_combo

  # Apply the Jockey function for Group races only
  jockey_combo <- jc(race_filter = "group",
                             jockey = jockey)

  # Add results row by row to the previously defined list
  row_jc[[i]] <- jockey_combo

  # Apply the Trainer/Jockey function for Group races only
  trainer_jockey_combo <- tj(race_filter = "group",
                             trainer = trainer, jockey = jockey)

  # Add results row by row to the previously defined list
  row_tj[[i]] <- trainer_jockey_combo

  # Apply the Sire function for Group races only
  sire_combo <- sr(race_filter = "group",
                             sire = sire)

  # Add results row by row to the previously defined list
  row_sr[[i]] <- sire_combo

  # Create a final dataframe
  stats_final_tr <- as.data.frame(do.call("rbind", row_tr))
  stats_final_jc <- as.data.frame(do.call("rbind", row_jc))
  stats_final_tj <- as.data.frame(do.call("rbind", row_tj))
  stats_final_sr <- as.data.frame(do.call("rbind", row_sr))

}

# Create a new variable called racecard. Bind together the generic race details with the newly created stats
racecard <- cbind(group_races_only,stats_final_tr)
racecard <- cbind(racecard,stats_final_jc)
racecard <- cbind(racecard,stats_final_tj)
racecard <- cbind(racecard,stats_final_sr)

# Filter for Diamond Jubilee Only
diamond_jubilee <- dplyr::filter(racecard,
                                 grepl("Diamond Jubilee",
                                       race_title))

# Filter for just the IV columns which we will plot
racecard_filtered_iv <- diamond_jubilee[,c("name","tr_iv","jc_iv", "tj_iv", "sr_iv")]

# Convert the racecard from wide to long format
racecard_long_iv <- melt(racecard_filtered_iv, id.var="name")

# Plot a stacked barchart
ggplot(racecard_long_iv, aes(x = name, y = value, fill = variable)) +
  geom_bar(stat = "identity") +
  theme(axis.text.x = element_text(angle = 45, hjust = 1))

# Filter for just the AE columns which we will plot
racecard_filtered_ae <- diamond_jubilee[,c("name","tr_ae","jc_ae", "tj_ae", "sr_ae")]

# Convert the racecard from wide to long format
racecard_long_ae <- melt(racecard_filtered_ae, id.var="name")

# Plot a stacked barchart
ggplot(racecard_long_ae, aes(x = name, y = value, fill = variable)) +
  geom_bar(stat = "identity") +
  theme(axis.text.x = element_text(angle = 45, hjust = 1))

# Filter for just the AE columns which we will plot
racecard_filtered_all <- diamond_jubilee[,c("name","tr_iv","jc_iv", "tj_iv", "sr_iv",
                                            "tr_ae","jc_ae", "tj_ae", "sr_ae")]

# Convert the racecard from wide to long format
racecard_long_all <- melt(racecard_filtered_all, id.var="name")

# Plot a grouped barchart
ggplot(racecard_long_all, aes(x = name, y = value, fill = variable)) +
  geom_bar(position = "dodge", stat="identity") +
  theme(axis.text.x = element_text(angle = 45, hjust = 1))