
July Cup Day at Newmarket, through the lens of Smartform runner insights
By colin on Saturday, July 11th, 2026All week we have been previewing the July Festival through the Smartform runner insights tables — reading each day’s most promising handicap by how a horse stood on the morning of its race, and bringing the breeding in only where it can answer a question the form cannot. The point is less the selection than what the data shows you on the way to one. Today, on the biggest card of the week, it shows quite a lot.
Today’s pick is the 2:52 mile handicap for three-year-olds — the race that ran for the last decade as the bet365 Mile and carries the Weatherbys name this year. Of all six of the festival’s big handicaps, this is the one that read best when we tested it: not just a form profile, but a genuine trainer-form angle and a mild draw lean that both survived being checked against years we had held back. There are notes on a couple of the day’s other races — the July Cup and the Bunbury — at the foot of the piece.
2:52 — Weatherbys Handicap
One mile, Class 2, three-year-olds, £50,000.
The winning shape here is the same improving three-year-old that has run through this whole week, with two additions that earned their place in testing. First, the profile: a lightly-raced colt who won last time and is stepping up in class, carrying a mark the handicapper has raised — the horse whose recent form has outgrown its rating. Second, the yard, used the useful way round. Nearly every winner of anything comes from a stable in form, so “warm yard” on its own tells you little. The negative is what earns its keep: a horse that fits the profile but whose yard is cold is one to strike out, and that filter did real work in both the years we held back. Third, a draw lean: in mid-sized fields the higher stalls have outperformed, by a few points, on a large sample. Today’s nine runners put us squarely in that mid-sized band — so today, the draw counts.
| Stall | Runner | Price | Mark today (from) | Rivals beaten, last two | Class / last win | Yard form (runs) |
|---|---|---|---|---|---|---|
| 1 | Eklleem | 4.5 | 87 (from 76) | 100% / 67% | up 1, won LTO | 64.1 (785) |
| 2 | Alfaraz | 8.5 | 88 (from 88) | 100% / 43% | up 2, won LTO | 57.0 (928) |
| 3 | Moonfall (fav) | 3.25 | 97 (from 90) | 100% / 64% | level, won LTO | 58.0 (143) |
| 4 | Wild Thoughts | 11.0 | 89 (from 84) | 86% / 100% | up 2, 2nd LTO | 52.9 (78) |
| 5 | Sunset On Leros | 34.0 | 95 (from 97) | 27% / 13% | level, 12th LTO | 52.9 (253) |
| 6 | Wechaad | 5.5 | 95 (from 95) | 79% / 81% | level, 7th LTO | 64.2 (539) |
| 7 | St Anton | 13.0 | 91 (from 91) | 55% / 100% | level, 14th LTO | 52.2 (1187) |
| 8 | Iron Lily | 15.0 | 96 (from 97) | 0% / 50% | down 1, 7th LTO | 55.1 (188) |
| 9 | Tales Of Wisdom | 11.0 | 99 (from 100) | 7% / 100% | level, 28th LTO | 60.5 (249) |
Reading the columns. Mark today (from) shows today’s official rating and where it stood two runs back — so “87 (from 76)” is a horse raised eleven pounds as its form improved. Rivals beaten is the percentage of the field the horse finished in front of, last time and the time before. Yard form is how the stable’s runners have been performing on that same scale when brought back after a similar break, runs in brackets; 50 is par, and a small sample tells you little. Those trainer patterns are set out at betwise.co.uk/insights.
Eklleem is the profile in its clearest form. Four starts, won last time up in class, beat every rival, and the mark tells the tale — raised eleven pounds as the penny dropped. Haggas’s yard is the warmest in the race on a big sample. He is the horse whose rating is chasing his form rather than describing it. Moonfall, the favourite, fits it too — won last time, beat everything, a stable going well. And Alfaraz is the same shape at a bigger price, up two classes.
The interest is that the two trends point different ways. The form profile likes Eklleem, Alfaraz and Moonfall — who are drawn one, two and three, on the wrong side of a draw lean that, in a mid-sized field like today’s, has favoured the higher stalls. The tidy resolution would be a well-fancied horse drawn high, and there isn’t one: the three highest stalls all fall to the cold-yard reading. St Anton (stall seven) comes from a below-par yard with a negative booking pattern and was beaten a long way last time; Iron Lily (stall eight) is two months off and dropping in class; Tales Of Wisdom (stall nine) is from a warm Appleby yard but was tailed off last time and carries the coldest jockey booking in the race.
Which leaves the middle of the draw, and Wechaad in stall six — the most interesting horse on the page for anyone reading the trends rather than the tips. He is not the improver the profile is built around: he has not won and is not stepping up, he is the exposed, consistent sort. But he beat around 80% of his rivals in each of his last two, Roger Varian’s yard reads as warm as any here, and Ryan Moore takes the ride — and he sits a good deal closer to the favoured end of the draw than the three at the head of the market. Every instrument likes him a little; none of them loves him. That is its own kind of signal.
So the trends lay the race out like this: Eklleem the standout on form, drawn awkwardly; Wechaad the one the draw and the yard both nod at, without the winning-form angle; Moonfall the favourite bridging the two. Which of those matters most on the day is the judgement — and that part is yours. What the data has done is turn a nine-runner handicap into three horses worth the argument, and told you exactly why each is there.
Two others we looked at
A word on two more of today’s races, both because of what our reading could not do with them — which is as much a part of the picture as the race it could.
4:35 — Al Basti Equiworld July Cup (Group 1, 6f)
The festival’s centrepiece, and a race where the breeding tables — which read some of the meeting’s Pattern races quite nicely — have almost nothing to add. The July Cup is contested by horses who are already, to a one, bred for speed: the sire lines that win it are a tight little pool of the same fast names over and over. That is exactly why the pedigree does not separate them. When every runner is by a speed sire, the sire tells you nothing about who wins; the whole field has passed the same test. So we would not reach for a breeding angle here. This is a race to judge on the plainest thing there is — who is the best sprinter, in the best form, on the day — and to let the pedigree sit quietly in the background where, for once, it belongs.
3:25 — Betway Bunbury Cup (Heritage Handicap, 7f)
And then the Bunbury, the race we have spent more time on than any other and have the least to offer you about — which is itself the finding. We tried it every way we know. The preparation profile. The handicapper’s pen. Buried good runs from two or three starts back. Trainer and jockey form. Breeding. Two versions of a theory we rather liked, about horses well in against the best they have ever shown. And, because half the field arrives here straight out of Royal Ascot, whether the Ascot run held a clue. Every angle described the winner and fifteen losers equally well. The Bunbury is built to be exactly this — a big field of exposed handicappers the assessor has squeezed into a single furlong of ability — which is why it throws up its 25/1 and 33/1 winners and buries its favourites. If you play it, take a big price and enjoy it. We can tell you, with more evidence than we can tell you almost anything else this week, that we cannot tell you who wins it.
That is the meeting. The mark paths, the rivals-beaten figures and the draw record all come straight from the Smartform data — run the same columns yourself in daily_runners_insights, set them against the trainer patterns at betwise.co.uk/insights, and you will see exactly the picture we did, including the two races today where the honest answer was that there was nothing there to find.
The July Festival’s big handicaps, through the lens of Smartform runner insights – Day 2
By colin on Friday, July 10th, 2026At Royal Ascot we read the meeting through the breeding tables. Across the July Festival we are leaning on a different part of Smartform — the runner insights tables — and bringing the breeding in where it can answer a question the form cannot. We have pointed both at the meeting’s races to see which are best suited to this kind of reading, and each day we pick one to read in that light.
Yesterday there were clearer candidates. Today took more thought, and the reason why is worth a paragraph of its own.
The obvious candidate was the 1:50, the ten-furlong Heritage Handicap for three-year-olds. It is a race we have looked at closely: seventeen runnings, fields averaging twelve, and a winner profile that holds up reasonably well — the lightly-raced sort who won or ran a cracker last time and is stepping up in trip or class. Then the declarations came out and it is a six-runner race. The smallest field in any of those seventeen renewals was seven. In a six-horse handicap a profile that narrows the field to two horses has not really narrowed anything, and we would rather say so than pretend otherwise.
So we have gone to the 3:00 instead. It is a trappier race, and a more interesting one.
3:00 — Betway Trophy (Heritage Handicap)
One mile six furlongs, Class 2, four-year-olds and upwards, £100,000.
Straight away, the caveat. This race has only been run in its present form since 2018 — nine runnings. We built our reading from six of them and looked at the other two. That is not enough to call a profile tested, and we will not dress it up as one. What we have is a steer, and a coherent one.
Every winner in those six derivation years came into the race with a strong recent run behind them, a mark the handicapper had left alone or eased rather than raised, and stamina they had already demonstrated on the racecourse — a win at this trip or beyond, or a previous placing in this very race. This is not a plot-horse contest. It is a race for the proven stayer who happens to be in form.
The other thing that stands out is how kindly it treats its own. Live Your Dream won it twice. Oneforthegutter, who lines up again today, won it last year having finished second in it the year before. Horses who have gone well over this course and distance keep coming back and keep running well, which makes some sense over a mile and six at Newmarket: it is a searching test and some horses simply handle it.
| Runner | Price | Age | Mark, last three runs → today | Rivals beaten, last two | Runs at trip (wins) | Course place strike | Yard form (runs) |
|---|---|---|---|---|---|---|---|
| Wine Dark Sea (fav) | 2.0 | 4 | 75 → 78 → 83 → 83 | 100% / 100% | 0 | 100% | 53.0 (24) |
| Valedictory | 4.0 | 4 | 84 → 87 → 87 → 92 | 100% / 62% | 1 (1) | 0% | 57.2 (336) |
| Goblet Of Fire | 7.0 | 6 | 119 → 83 → 83 → 90 | 100% / 50% | 3 (1) | 100% | 63.4 (27) |
| Oneforthegutter | 15.0 | 7 | 93 → 91 → 90 → 88 | 36% / 14% | 10 (1) | 40% | 50.9 (592) |
| Majestic | 15.0 | 8 | 94 → 92 → 90 → 90 | 83% / 50% | 0 | 43% | 64.4 (48) |
| Pole Star | 21.0 | 4 | 89 → 89 → 88 → 86 | 9% / 67% | 5 (2) | 67% | 53.4 (136) |
| Beylerbeyi | 21.0 | 6 | 101 → 101 → 100 → 100 | 63% / 40% | 0 | 100% | 50.9 (592) |
| Asgard’s Captain | 34.0 | 6 | 89 → 92 → 92 → 92 | 42% / 75% | 1 (0) | 100% | 62.5 (35) |
| Real Dream | 34.0 | 7 | 103 → 101 → 99 → 97 | 20% / 45% | 9 (1) | 100% | 50.9 (592) |
| Roaring Legend | 34.0 | 6 | 104 → 104 → 104 → 103 | 20% / 0% | 5 (1) | 0% | 48.4 (11) |
Forecast prices in decimal. Marks read antepenultimate → penultimate → last time out → today.
Reading the columns. Mark is the official rating the horse carried at each of its last three starts and the one it carries today. Rivals beaten is the percentage of the field the horse finished in front of last time and the time before — a fairer measure of a run than the bare finishing position. Runs at trip counts previous starts over a mile and six, with wins in brackets. Yard form is how the stable’s runners have been performing on that same rivals-beaten scale when brought back after a similar break, with the number of runs behind the figure in brackets; 50 is par, and a small sample tells you little. Those trainer patterns are set out at betwise.co.uk/insights.
A word about the 119
Goblet Of Fire’s mark three runs back reads 119, against 83 for the two starts either side of it. That is not a rating collapse. Given the yard, it will be a hurdles mark: the insights table carries whatever official rating applied to the horse’s last run, whichever code it was run under. Check race_type before you read a story into a number like that. It is the sort of thing that will trip you up exactly once.
The stamina question, and a warning about percentages
A mile and six is a genuine test, and three of these ten have never faced it. Wine Dark Sea, the even-money favourite, has never run beyond eleven furlongs. Nor has Beylerbeyi, dropping back from two and a half miles. Nor has Majestic.
This is precisely where you would want a pedigree to speak, and it is why we went and asked. Our experimental breeding tables carry, for every runner, how the sire’s progeny have performed over today’s distance, how the dam’s have, and how the cross of sire and broodmare-sire has — each with the number of runs behind the figure.
For Wine Dark Sea, the answer is silence. His dam has no progeny who have run at this trip. The cross has none either. His sire’s distance figure sits at 51.4 — par, on seventy-four runs, so we can trust that it is genuinely unremarkable rather than merely unknown. The pedigree does not tell us he stays. It does not tell us he doesn’t. It simply has nothing to say, and on the one horse in the race where a stamina read would be most valuable.
Which brings us to the number that does catch the eye, and the lesson in it. The sire-and-broodmare-sire cross behind Goblet Of Fire — Saxon Warrior over a War Front mare — shows 94.4% of rivals beaten at this trip. A stayers’ nick, firing. Except that the sample size beside it reads 2.
We went and looked at who those two runners were. Every runner from that cross to have gone a mile and six in the last five years is Goblet Of Fire himself. Two qualifying turf runs: second of ten at Goodwood last August, 88.9% of rivals beaten; and first of twelve at Newmarket this May, 100%. The mean is 94.44%. His Wolverhampton second does not count — the figure is for turf — and a 2024 Goodwood run does not count because he did not finish.
So the pedigree number is his own form, averaged, and handed back wearing a different hat. It is not independent evidence of anything. Read it without the sample-size column beside it and you would take it as confirmation that the breeding says he stays; in fact the breeding says nothing, and the horse’s own record says everything. Never read a percentage in these tables without the count next to it.
The reading
Strip the circular number away and Goblet Of Fire is left standing on exactly what this race has rewarded. He won over this course and distance in May, beating eleven. Three runs at the trip, one win, a hundred per cent course place strike. He won last time out, beating every rival, with a useful-run flag. He is, on the profile, the in-form proven stayer, and he is a 7.0 chance.
Two things give us pause and we would rather name them. He has been off for sixty-eight days. And the handicapper has put him up seven pounds for that win, which is the opposite of the eased mark our derivation winners carried. The yard reads warm but on twenty-seven runs, which is too few to lean on.
Valedictory is the other genuine fit. Won last time, beat everything, has a win at the trip, six starts, and the strongest stable-and-jockey combination in the race. Against him: one run at a mile and six to Goblet Of Fire’s three, and no course form whatsoever.
The favourite is the interesting one. Wine Dark Sea won last time and — unusually — races off an unchanged mark of 83, which is the shape of a horse the handicapper has not yet caught. He beat every rival in each of his last two. On yesterday’s three-year-old logic he would be the obvious answer. But this is not that race. He has never gone the trip, he is stepping up two classes, and, as above, nothing in the breeding will tell you whether he gets home.
And then Oneforthegutter, who won this race last year and was second in it the year before, available at 15.0 this afternoon with the worst recent form in the field — 36% and 14% of rivals beaten in his last two. He fails one half of the profile completely and passes the other half completely: ten runs at the trip, a course-and-distance record, and a proven liking for this specific race. Our reading cannot dismiss him and cannot recommend him. On a nine-year sample, we are not going to pretend that tension is resolved.
Goblet Of Fire is the pick, Valedictory the alternative, and the favourite carries a stamina question the data cannot answer.
That is today’s “trends” pick. The mark paths, the rivals-beaten figures and the distance records come straight from the Smartform data — run the same columns yourself in daily_runners_insights, set them against the trainer patterns at betwise.co.uk/insights, and you will see exactly the picture we did, including the parts that did not work.
The July Festival’s big handicaps, through the lens of Smartform runner insights
By colin on Thursday, July 9th, 2026At Royal Ascot we read the meeting through the breeding tables. Across the July Festival we are using a different part of Smartform: the runner insights tables. We have pointed them at the meeting’s races to see which are best suited to this kind of reading, and each day we pick one to read in that light.
The tables doing the work are daily_runners_insights and its historical twin historic_runners_insights. Between them they carry a few hundred leak-free columns describing every runner exactly as it stood on the morning of its race: how its official mark has moved across its last three starts, what proportion of the field it beat each time, whether it stepped up in class, how long since it ran. Alongside those we lean on the trainer days-since-ran patterns — how a yard’s runners perform depending on the gap since their last outing — which you can see set out at betwise.co.uk/insights.
The method is deliberately slow. We took the meeting’s races one at a time, built a profile of the typical winner from the runnings up to 2023, wrote that profile down, and only then tested it against 2024 and 2025 — two years we had held back and not looked at. The results varied more than we expected. Some races read well. Some read loosely. Some have fields too small to test honestly at all. And one defeated every angle we threw at it.
Today’s pick is one of the ones that reads.
3:00 — Betway Handicap (Heritage Handicap)
Six furlongs, Class 2, three-year-olds, £100,000.
The trend you will see quoted this morning concerns the draw: nine of the last eleven winners came from stall eight or higher. We have looked at the draw over Newmarket’s summer sprint trips and have not found it to be significant. Eleven runnings is a thin sample, and when we tested a draw bias over six furlongs here against renewals we had held back, it did not survive. That is not to say there is nothing in it — only that we cannot find it, and we would not move a horse up or down on it.
What does matter is the direction of the handicapper’s pen. The insights tables carry each horse’s official rating not just for today but for each of its last three starts, so you can watch the assessor forming his opinion in public.
Look at the recent winners. Dancing Star came here in 2016 rated 75, then 80, then 89 — and won off 96. Quinault won in 2023 having gone 74, 74, 85, 90. Sergeant Wilko in 2024: 78, 85, 84, 87. Prince Of India last year: 77, 80, 84, 87. Every one was being put up, run after run. Every one won anyway.
That is the whole thing. In this race, over these years, the rising mark has not been a warning — it has been the evidence. The winner has tended to be the three-year-old improving faster than the handicapper can raise him. Whether that holds because young horses improve between runs quicker than an assessor can react, we cannot prove from the data; but by midsummer there is enough form on the page for the pattern to show.
| Runner | Price | Mark, last three runs → today | Rivals beaten, last two | Runs | Yard form (runs) |
|---|---|---|---|---|---|
| Sea Cookie | 9.0 | — → — → 79 → 84 | 100% / 100% | 4 | 56.6 (73) |
| Thunder Call (fav) | 4.5 | — → — → 85 → 91 | 100% / 100% | 4 | 64.1 (783) |
| Red Spells Danger | 7.0 | 79 → 79 → 89 → 93 | 95% / 100% | 9 | 49.2 (848) |
| Calico Blue | 7.0 | — → 91 → 93 → 93 | 88% / 88% | 5 | 64.2 (537) |
| Starmade | 11.0 | 80 → 80 → 88 → 88 | 85% / 100% | 6 | 52.0 (329) |
| River Spey | 15.0 | 84 → 84 → 83 → 87 | 100% / 29% | 8 | 59.5 (311) |
| Ten Carat Harry | 9.0 | 97 → 101 → 101 → 101 | 92% / 40% | 14 | 52.3 (113) |
| Man Of Vision | 9.0 | — → 87 → 90 → 90 | 62% / 90% | 5 | 59.9 (247) |
| Jazl | 13.0 | — → 85 → 95 → 95 | 0% / 100% | 5 | 57.8 (195) |
| May Angel | 15.0 | 95 → 95 → 95 → 95 | 73% / 78% | 7 | 62.0 (795) |
| Pilu | 17.0 | 87 → 87 → 86 → 88 | 91% / 50% | 5 | 45.0 (84) |
| Ghost Mode | 26.0 | 98 → 97 → 96 → 94 | 50% / 11% | 9 | 56.9 (926) |
| Mo Of Cairo | 34.0 | 84 → 84 → 82 → 81 | 67% / 62% | 7 | 50.7 (622) |
Advertised is a non-runner. Marks read antepenultimate → penultimate → last time out → today; a dash means the horse had not yet been rated. Forecast prices in decimal.
Reading the columns. Mark is the official rating the horse carried at each of its last three starts, and the one it carries today — the handicapper’s opinion, revised in public. Rivals beaten is the percentage of the field the horse finished in front of last time and the time before; a fairer measure of a run than the bare finishing position, since eighth of twenty-eight is a very different afternoon from eighth of nine. Yard form is how the stable’s runners have been performing on that same rivals-beaten scale when brought back after a similar break, with the number of runs behind the figure in brackets — 50 is par, and a small sample tells you little.
Sea Cookie is the closest thing to the archetype. Four starts in his life. Won last time, stepping up two classes out of a Class 4, and put up five pounds for it. He has beaten every rival in each of his last two runs, has two wins in the last ninety days, and already owns a course-and-distance win. Lay him alongside Sergeant Wilko and Prince Of India and it is very nearly the same horse. The reservation is his yard’s figure, which reads well but on only seventy-odd runs — too few to lean on.
Thunder Call is the same shape and makes no secret of it. Won last time, raised six pounds, every rival beaten in each of his last two, four starts, and the strongest yard in the race behind him on a properly powered sample. The profile likes him and so does the market. Worth saying plainly rather than pretending otherwise: when the data and the betting agree, you are not being paid for the insight.
Red Spells Danger has the steepest curve on the card — 79, 79, 89, 93, fourteen pounds across three runs, with 95% and then 100% of his rivals beaten. On the form line alone he is arguably the most improving horse here. The one thing that gives us pause is his yard’s current figure, the coldest of the fancied runners, on a large number of runs. We should be straight that we have not tested whether a cold yard matters in this race — it did tell in another of the festival’s handicaps — so treat it as a raised eyebrow rather than a strike.
Then the other side of the ledger. Ten Carat Harry is top-rated on 101, a course-and-distance winner, seven wins at the trip from fourteen starts. He may well run a fine race. But his mark has not shifted across his last three runs, and he is the most exposed horse in the field — whatever the profile above is picking up, he is not it. Ghost Mode and Mo Of Cairo are travelling the other way entirely, drifting down the weights.
The profile points to Sea Cookie at a price and Thunder Call at a short one; Red Spells Danger is the improver with a question behind him. On the draw, we have nothing to add.
That is today’s “trends” pick. The mark paths and the rivals-beaten figures come straight from the Smartform data — run the same columns yourself in daily_runners_insights, set them against the trainer patterns at betwise.co.uk/insights, and you will see exactly the picture we did, including the parts that did not work.
Royal Ascot Recap: What Smartform’s Breeding Data Taught Us
By colin on Sunday, June 21st, 2026Five days, every card read through Smartform’s pedigree data before a horse ran. This is the honest account we promised — where the breeding lens saw clearly this week, where it was right to stay quiet, where it got things wrong, and the one lesson that ties it all together.
The idea was simple, and it wasn’t tipping — and it wasn’t improvised on the morning, either. Behind the week sat a long piece of work. We’d gone back over two decades of Royal Ascot, and a great deal of other top-class racing besides, and run the breeding figures from these same tables across all of it, to learn where the pedigree stats genuinely separate winners from the field and where they tell you nothing. That study is the map we read each card against — and, as much as anything, it’s what told us in advance which races to leave well alone.
So each morning we took the card and read it through the breeding tables — daily_dams_insights, daily_sires_insights and the experimental nicks layer for the cross of sire and damsire — and said, before racing, which races the pedigrees pointed to a winner in and which they couldn’t call at all. Posted in advance, every day, with no hiding from it afterwards. Here’s how it read.
Where the breeding earned its keep
The clearest and most repeatable edge was the sire read in the two-year-old sprints. Three times we pointed past a short-priced favourite to a better-bred sort at a bigger price, and three times it landed: the Coventry, where Great Barrier Reef (No Nay Never) won at 6/1 with the favourite only sixth; the Albany, where Libertango (No Nay Never again) beat an odds-on jolly at 6/1; and on the final day the Norfolk, where Orthodox (Havana Grey) won at 9/2 with the favourite back in ninth. That’s a pattern, not a fluke. At two and three, before the form book has much to go on, the sire line is a real and badly under-used guide — and it tends to be priced as though no one is looking, because mostly no one is.
A caveat ran right through those wins, and it’s an honest one: the sire figure points to the line, not the individual. We said so every time, and every time the winner came out of the line we’d named without always being the one we — or the market — fancied. The Chesham was the clearest example: we said Justify was the sire to be on but couldn’t tell you which of his runners, and after the favourite was withdrawn his other two filled the first two places.
The second edge was reading stamina and trip, where the form book is blind. The King Edward VII was the sharpest call of the week: we doubted a Kingman colt’s stamina at a mile and a half, and he was beaten ten lengths while the two horses we’d named as better bred for the trip fought out the finish in front of him. The Queen Alexandra marathon confirmed the same principle on the last day — Illinois, the deepest-evidenced staying cross on the card, won it, while the sprint-into-mile cross we quietly doubted at the trip trailed in.
The third was the dam, but only where the mare had a real body of runners behind her. The Prince of Wales’s was the standout — Ombudsman confirmed through the dam, with the 15/2 Minnie Hauk flagged for the places behind him — and the Hardwicke on Saturday turned up a 9/1 winner in Giavellotto, with the dam-confirmed favourite second.
Where it was right to say nothing
As much of the week’s value was in the races we left alone as in the ones we read, and that’s the part the prior research mattered for most. These weren’t hunches: across the two decades we studied, the breeding figures simply stop separating winners in handicaps and at the top of the sprinting tree, so we left every one of those races before the meeting even began — and nothing this week argued otherwise. Every elite open sprint went straight into the leave-alone pile — the King Charles III, the Commonwealth Cup, and on Saturday the Queen Elizabeth II Jubilee, where a 25/1 shot won a blanket finish with the favourite only third. That is the textbook proof: at the top of the sprinting tree the fastest horse on the day wins, and pedigree cannot separate a field all bred to the hilt for the job. Every big-field handicap went the same way — the Royal Hunt Cup, the Britannia, the Wokingham, the Golden Gates — where the weights and the market wash the breeding out. Knowing which races the data can’t call is every bit as much the method as knowing which it can.
One race we stood aside from for a subtler reason worth keeping. The Coronation is a fillies’ Classic, and the dams of three-year-old fillies are young mares whose records are dominated by the runners themselves — so the figures look like signal and are really a mirror. We showed the working and left it; the favourite won, which the dam data could neither have predicted nor opposed. Standing aside from a race you genuinely can’t read is a result, not a gap.
Where it got it wrong
The misses clustered, and the cluster is the most useful thing in this whole review. Almost all of them were the nick — the cross of sire and damsire — on a thin sample. The Ascot Stakes, and most of all the Queen’s Vase, our showcase pick of the week, which ran tenth of eleven on a cross that simply had too few runners behind it to mean anything. The nick is the most data-hungry of the three layers and the quickest to mislead when the numbers are short; it earns its place only on real samples, and this week it was the layer that cost us most.
The rest were of two kinds. A couple of soft sire leans that we’d flagged as soft and that duly came up short, the Hampton Court chief among them. And, on the final day, a confirmatory read that backfired: the Jersey, where we endorsed the best-bred favourite and then watched him run sixth while a 20/1 winner came from a sire we’d ranked only mid-field — a clean reminder that simply agreeing with the market leaves you nothing to fall back on when the favourite underperforms. The Gold Cup sat between the two camps: our preferred pair were beaten by the favourite, but we’d said the breeding had no edge among proven older stayers, and that half held — our two were placed, with nothing the market hadn’t already known.
The one lesson, if it comes down to one
Breeding data earns its keep on aptitude and stamina at the top level — the juvenile sprints, the staying trips, the good-class Group races where the field isn’t fully exposed and the market hasn’t fully priced the page. It goes quiet, and should be left quiet, in handicaps and elite sprints, where weights or sheer class wash the edge away. And it should never be trusted on a thin sample, however eye-catching the headline figure: the runs count isn’t a footnote, it’s the first number to read. The Queen Alexandra made that point twice in one race, where the two thinnest figures in the field ran in opposite directions — which is exactly why a low run count is a reason for caution, not a number to back or to oppose. None of this was the week’s discovery: two decades of results pointed to it before the meeting began, and five days of reading the cards in public simply bore it out.
That discipline is the whole thing. The question that turns a pedigree table from a curiosity into an edge isn’t “what does the breeding say?” — it’s “where is the breeding worth listening to?” This week the answer was: in the juvenile sprints, at a trip, and out of a proven mare; not in a handicap, not in a championship sprint, and not on three runs.
All of it is there to run yourself, any day and any card, in Smartform — the same dam, sire and nick tables we read from, the same figures, the same runs counts beside them. We followed it through one particular lens for five days and showed our working, hits and misses alike. It’s a lens worth following race by race, win or lose. Thanks for reading along this week.
Royal Ascot Final Day: What Smartform’s Breeding Data Says, Race by Race
By colin on Saturday, June 20th, 2026The fifth and final day of the Royal meeting — and the same approach one last time: not tips, but what Smartform’s breeding data makes of Saturday’s card. Three races where the pedigrees have something to say, and several where, as on any Saturday, the honest move is to leave well alone.
How Friday went
Friday was the meeting’s best day for the reads. In the Albany we took on the odds-on favourite Sun Goddess, whose Sioux Nation profile we’d called only middling, and named three better-bred alternatives — and one of them, Libertango (No Nay Never), won at 6/1, the favourite turned over into second. The honest detail underneath: of our three, the winner was the middle one, while the profile we’d actually rated highest, Silent Beauty, trailed in down the field. So the sire read picked the right race to oppose the favourite in, not the right individual — the Coventry lesson a third time. But opposing an odds-on jolly and pulling the winner out of your named group at 6/1 is a hit however you cut it.
The King Edward VII was the cleanest read of the week. We doubted the Kingman colt Water To Wine on stamina at a mile and a half, and the trip found him out by ten lengths; the two we’d named as better bred for it, Causeway and Ancient Egypt, duelled out the finish in front of him. The market had come to the same view by the off, shortening Causeway to the Evens favourite — the read and the money landing on the same side.
The Coronation we’d set aside as unreadable through the dam, on the young-mare contamination, and the favourite Precise duly won — the market right in a race our lens had nothing to say about. A clean stand-aside, no edge claimed and therefore nothing lost. The Commonwealth Cup went to its favourite, the elite sprint where pedigree can’t separate the field, and the big staying and mile handicaps, the Duke of Edinburgh and the Sandringham, went to the pack — all correctly left alone.
The method is unchanged. It comes out of Smartform’s breeding tables — daily_dams_insights and daily_sires_insights, which score every runner’s dam and sire line by distance and going — with the experimental nicks layer for the cross of sire and damsire. We’ve worked out across thousands of past races where breeding genuinely points to a winner and where it tells you nothing, and what follows is that work turned on the final card.
One number throughout: PRB, percentage of rivals beaten, is our field-size-adjusted measure of how well a line’s runners have run on average. 0.50 is dead average; the further above, the better the typical run. It is steadier than strike-rate, and small samples remain the thing to watch — never more so than today, where the strongest-looking figures sit on the thinnest evidence.
2:30 — Norfolk Stakes (Group 2, 5f, 2yo)
The week’s last juvenile sprint, so the sire’s story again — but a soft one, because the profiles here are bunched tight in the mid-0.50s with no real daylight between them. For once that means no quarrel with the favourite: Carry The Flag (No Nay Never, 3.50) is fairly bred for it, with the best two-year-old precocity figure in the race (0.595) and a sound five-furlong record (0.528). But the page likes the second favourite Orthodox (Havana Grey, 7.00) every bit as much — Havana Grey edges him on pure five-furlong aptitude (0.550 on 773) and matches him for precocity, on enormous samples, at twice the price. If you want the distance flyer, Force Noir (Persian Force, 11.0) tops the field on raw five-furlong figure (0.586), though on a smaller 36-run sample.
| Sire | Runs | PRB (5f) | This year’s runners (forecast) |
|---|---|---|---|
| Persian Force | 36 | 0.586 | Force Noir (11.0), Persian Spring (34.0) |
| Havana Grey | 773 | 0.550 | Orthodox (7.00), El Floridita (67.0) |
| Starman | 113 | 0.543 | Star Prospect (11.0) |
| Mehmas | 1129 | 0.534 | Flight Signal (8.00), Agamemnon (26.0) |
| No Nay Never | 424 | 0.528 | Carry The Flag (3.50), New Yorker (21.0) |
| Blue Point | 337 | 0.517 | Tribeca (11.0) |
Sires’ five-furlong record over the last five years; the two-year-old precocity figures are discussed in the text. Tiny-sample sires — a couple flatter at 100% on one or two runs — are left out as noise. Forecast prices in decimal.
No quarrel with the favourite, but the breeding likes the second-favourite Orthodox just as much at twice the price, with Force Noir the distance flyer if you want one.
3:05 — Hardwicke Stakes (Group 2, 1m4f, 4yo+)
A mile-and-a-half Group for older horses, and a neat demonstration of why we always show the run counts. The flashiest dam figures in the race are pure noise — three of them sit above 0.875 on two or three runs apiece, which is just the horse’s own family talking back to it. Strip those out and read the broader Flat record, where the samples are real, and the dam line simply agrees with the market: the favourite Kalpana (out of Zero Gravity) has the strongest well-sampled maternal record in the field, 0.834 across 22 runs. If you want a breeding-led name at a price, Santorini Star (0.712 on 42, 15.0) and Giavellotto (0.675 on 62, 9.00) both carry genuinely deep maternal records. But this is the Gold Cup lesson once more — a field of proven older horses, where breeding mostly restates what the form already knows.
| Dam | Runs | PRB (Flat) | This year’s runner (forecast) |
|---|---|---|---|
| Zero Gravity | 22 | 0.834 | Kalpana (3.25) |
| Livia’s Dream | 42 | 0.712 | Santorini Star (15.0) |
| Pearl Diamond | 18 | 0.682 | Ethical Diamond (9.00) |
| Gerika | 62 | 0.675 | Giavellotto (9.00) |
| Gossamer Wings | 24 | 0.644 | Lambourn (21.0) |
| Devoted To You | 70 | 0.567 | Jan Brueghel (5.50) |
Dams’ broader Flat record over five years — the better guide here, since the distance-specific figures rest on two or three runs apiece and tell you nothing. Forecast prices in decimal.
Confirmation, not an edge: the dam line agrees with the favourite Kalpana, with Santorini Star and Giavellotto the deeper-bred names at a price — but among proven older horses the breeding only restates the form.
3:40 — Queen Elizabeth II Jubilee Stakes (Group 1, 6f, 4yo+)
The championship sprint of the meeting, six furlongs at the very top of the tree — and the same verdict as the July Cup and the Commonwealth Cup, every single time: at this level the fastest horse wins whatever the page says, and a field bred to the hilt for the job can’t be separated on pedigree. Leave alone.
4:20 — Jersey Stakes (Group 3, 7f, 3yo)
Seven furlongs for three-year-olds, and here the sire lens confirms the market rather than arguing with it. Saber Strike (Night Of Thunder, 3.25) is simply the best-bred runner in the race for this exact assignment — top-tier on both the seven-furlong figure (0.594 on 608) and the three-year-old figure (0.597 on 971), deep samples on each. The breeding agrees with the favourite, and there’s no value to take against him. The one honest footnote is Dorset (Wootton Bassett, 21.0), who owns the single highest raw seven-furlong figure in the field (0.607 on 426) — but a markedly weaker three-year-old record (0.516) and a big price, so he’s a distance-aptitude flyer without the precocity, not a pick.
| Sire | Runs | PRB (7f) | This year’s runners (forecast) |
|---|---|---|---|
| Wootton Bassett | 426 | 0.607 | Dorset (21.0) |
| Pinatubo | 122 | 0.598 | Domina Ignis (67.0) |
| Night Of Thunder | 608 | 0.594 | Saber Strike (3.25), Billecart (67.0) |
| St Mark’s Basilica | 80 | 0.573 | Thesecretadversary (9.00) |
| Havana Grey | 428 | 0.548 | America Queen (17.0) |
| Sioux Nation | 346 | 0.540 | Neolithic (13.0) |
Sires’ seven-furlong record over five years; the three-year-old (age) figures are discussed in the text. Forecast prices in decimal.
Confirmation, not value: the favourite Saber Strike is the best-bred runner for a seven-furlong three-year-old contest, on both trip and age — Dorset the raw-distance flyer if you want one, at a weaker age record and a price.
5:00 — Wokingham Stakes (Heritage Handicap, 6f)
One of the biggest betting handicaps of the year, a cavalry charge of a sprint across the full width of the track — the weights and the field between them wash out anything the breeding might see. Leave alone.
5:35 — Golden Gates Stakes (Handicap, 1m2f, 3yo)
A competitive middle-distance handicap for three-year-olds; the page can rank them well enough, and then the handicapper and the market wash the edge away, as in all of these. Leave alone.
6:10 — Queen Alexandra Stakes (2m5½f, 4yo+)
The longest race in Britain, and a fitting last word for the nick — the cross of sire and damsire, where staying power most often hides. It reads exactly as the Gold Cup did: confirmation, not an edge. The two market principals are also the two best-evidenced stayers. The favourite Le Destrier (Le Havre × Dubawi, 3.00) has the soundest figure at the trip itself, 0.637 on a real 28 runs; the second favourite Illinois (Galileo × Danehill, 4.00) has by far the deepest staying evidence on the card — around 0.57 to 0.59 across hundreds and then thousands of runs, the classic Coolmore stamina cross. The breeding confirms them both and beats neither. The flashier figures above them are the trap the run counts exist to catch: A Piece Of Heaven’s 0.776 and French Master’s 0.691 rest on eight and fifteen runs, speculative flags at most. And one quiet doubt — Columbus (Oasis Dream × Rip Van Winkle, 6.00) has no record at the trip and a below-average wider figure, a sprint-into-mile cross being asked to go two and a half miles.
| Cross (sire × damsire) | Runs | PRB (trip) | Runner (forecast) |
|---|---|---|---|
| Jukebox Jury × Sendawar | 8 | 0.776 | A Piece Of Heaven (8.00) |
| Frankel × Sea The Stars | 15 | 0.691 | French Master (6.00) |
| Le Havre × Dubawi | 28 | 0.637 | Le Destrier (3.00) |
| Galileo × Danehill | 294 | 0.567 | Illinois (4.00) |
| Oasis Dream × Rip Van Winkle | 0 | — | Columbus (6.00) |
Sire × damsire records at the staying trip, lifetime. The eye-catching figures at the top rest on single-figure samples — read them against the runs. The well-sampled crosses are the ones to trust. Forecast prices in decimal.
The Gold Cup again: the cross marks out Le Destrier and Illinois as the genuine stayers and agrees with the market, the flashier figures are too thin to follow, and Columbus is the one the breeding quietly doubts at the trip.
And that’s the meeting
Fittingly, Saturday is the newest of the five days. For most of the meeting’s history the Royal fixture ended on the Friday, and this card was run separately as the Ascot Heath meeting — the public’s day on the common after the Royal procession had gone home — only folded into the Royal week in 2002. So this is the natural place to stop and take stock, and we’ll be back with an honest week-in-review once the results are in: where the lens saw clearly, and where it didn’t.
As ever, none of this is a tip. You can run the same figures yourself in daily_dams_insights and daily_sires_insights, and the nicks layer behind them, and reach your own view. This has been analysis from one particular lens across the week — a lens worth following race by race, win or lose.
Royal Ascot Day Four: What Smartform’s Breeding Data Says, Race by Race
By colin on Thursday, June 18th, 2026Day four of the Royal meeting, and the same approach: not tips, but what the Smartform breeding data makes of Friday’s card — where the pedigrees point, where they don’t, and today one race where they only look as though they do.
How Thursday went
Thursday read well, on the whole. In the Chesham the sire pointer was right, and its caveat with it: we’d said Justify was the sire to be on but that the figure can’t pick which of his runners — and after the favourite Aix La Chapelle was withdrawn at the stalls, his other two, Nola Soul and On Just Terms, filled the first two places. Our Frankel value angle, Pikachu, ran a fair fifth without landing. In the Ribblesdale, which we’d called too thin to back or oppose, the single speculative flag we allowed — Johanna Walsh at 9/1 — ran second, beaten only a head, while the bare favourite came seventh.
The Gold Cup confirmed the framing more than the pick. We’d preferred Trawlerman and Sweet William to the favourite — wrong for the win, as Scandinavia beat Trawlerman a head, with Sweet William third at 11/1 — but we’d also said the breeding has no edge to offer in a field of proven stayers, and that was the truer half: our two were there at the finish without anything the market hadn’t already priced in. The five-run spike we’d flagged to ignore, Caballo De Mar, trailed in last.
The one that didn’t fire was the Hampton Court, where our soft Dubawi lean came up short — Maho Bay fifth, Morshdi ninth, an 18/1 winner from a middling profile. The two handicaps we left alone, the Britannia and the Buckingham Palace, went as their kind do: mid-priced winners from big fields, nothing the page could have helped with.
The method is unchanged. It comes out of Smartform’s breeding tables — daily_dams_insights and daily_sires_insights, which score every runner’s dam and sire line by distance and going — with the experimental nicks layer for the cross of sire and damsire. We’ve worked out across thousands of past races where breeding genuinely points to a winner and where it tells you nothing, and what follows is that work turned on the fourth day’s card.
One number throughout: PRB, percentage of rivals beaten, is our field-size-adjusted measure of how well a line’s runners have run on average. 0.50 is dead average; the further above, the better the typical run. It is steadier than strike-rate, and small samples remain the thing to watch.
2:30 — Albany Stakes (Fillies’ Group 3, 6f, 2yo)
A juvenile fillies’ sprint, so the sire’s story again — but for once the breeding doesn’t follow the market. The favourite, Sun Goddess, is by Sioux Nation, a perfectly respectable but middling profile that sits well down the field’s order of merit. The page prefers others, and at prices: Jolivette, by Wootton Bassett — the juvenile sire of the meeting, whose filly won the Queen Mary — tops the list and is available at 11.0; Libertango (No Nay Never, the Coventry sire, on much the deepest sample here) is next at 9.0, and Silent Beauty (Night Of Thunder) the pick of the more fancied at 6.0. All three are better bred for the job than the jolly.
| Sire | Runs | Win % | PRB | This year’s runners (forecast) |
|---|---|---|---|---|
| Wootton Bassett | 155 | 28.4 | 0.692 | Jolivette (11.0) |
| Night Of Thunder | 150 | 19.3 | 0.615 | Silent Beauty (6.0) |
| No Nay Never | 506 | 20.6 | 0.607 | Libertango (9.0) |
| Havana Grey | 772 | 16.3 | 0.566 | Roxelina (34.0) |
| Sioux Nation | 347 | 17.0 | 0.562 | Sun Goddess (2.50), Love Is (26.0), Hidden Gift (26.0) |
| Showcasing | 605 | 10.9 | 0.501 | Light Of Dawn (7.50), Tall Trees (67.0) |
Sires’ two-year-old records at five and six furlongs over the last five years. Smaller-sample sires (Armor’s flattering 0.675 is just five runs) are left out as noise. Forecast prices in decimal.
A race the breeding doesn’t follow the market on: the favourite isn’t the best-bred filly here, and the page prefers Jolivette at a price — the same Wootton Bassett who delivered in the Queen Mary.
3:05 — Commonwealth Cup (Group 1, 6f, 3yo)
An elite three-year-old sprint, and the same verdict as Tuesday’s King Charles III: over six furlongs at this level the fastest horse wins whatever the page says, and pedigree tells you little the clock does not. Leave alone.
3:40 — Duke Of Edinburgh Stakes (Handicap, 1m4f)
A mile-and-a-half handicap, competitive and well-bet — the weights and the market between them wash out whatever the breeding sees, as in all of these. Leave alone.
4:20 — Coronation Stakes (Fillies’ Group 1, 1m, 3yo)
We’d normally read the Coronation through the dam, as we did the Prince of Wales’s — but not here. A dam’s record is only a signal when there’s a real body of runners behind her, and in a fillies’ mile Group 1 the dams are young mares with a foal or two of racing age, so the figures are dominated by the runners themselves. You can see it in the run counts — ones, twos, threes — and stripping each filly’s own form out takes what little edge there seemed to be with it. The dam lens earns its keep on older horses out of established mares, not on the young families of a Classic. A blank, honestly come by.
5:00 — Sandringham Stakes (Fillies’ Handicap, 1m, 3yo)
A big-field mile handicap for three-year-old fillies; breeding ranks them well enough, then the field and the weights wash the edge away. Leave alone.
5:35 — King Edward VII Stakes (Group 2, 1m4f, 3yo)
The “Ascot Derby”, over a mile and a half — and here the sire lens offers a doubt rather than a pick, which is its most useful contribution of the day. The favourite, Water To Wine, is by Kingman, a miler influence whose stock sit below the average line at a mile and a half: the breeding raises a genuine question over whether the jolly truly stays the trip. The rest are closely bunched, so there’s no strong alternative to hang it on — Causeway (Wootton Bassett) is the best-bred of the fancied at 3.00, Echo Of Stars (Sea The Stars) the stoutest profile on the deepest sample but a 34/1 outsider, Ancient Egypt (Frankel) sound enough at 11.0.
| Sire | Runs | Win % | PRB | This year’s runners (forecast) |
|---|---|---|---|---|
| Sea The Stars | 710 | 16.2 | 0.567 | Echo Of Stars (34.0) |
| Wootton Bassett | 185 | 14.6 | 0.541 | Causeway (3.00) |
| Lope De Vega | 483 | 13.3 | 0.533 | Golden Story (9.0) |
| Frankel | 582 | 19.6 | 0.532 | Ancient Egypt (11.0) |
| Kingman | 235 | 12.3 | 0.467 | Water To Wine (2.00) |
Sires’ records at a mile and a half over the last five years. The profiles are closely bunched, so this is a guide of degree — but note the favourite’s sire, Kingman, sits below the 0.50 line at the trip. Venetian Prince’s sire figure (three runs) is left out as noise. Forecast prices in decimal.
A doubt rather than a pick: the breeding questions whether the favourite stays, with Echo of Stars the best-bred of the outsiders if you want a positive read.
6:10 — Palace Of Holyroodhouse Stakes (Handicap, 5f, 3yo)
A five-furlong sprint handicap to close the day; efficiently bet, and no room for breeding to tell. Leave alone.
So that is Day Four — a quieter day for the lens, and an instructive one. The two reads it can make both pull against the market rather than with it: the Albany favourite isn’t the best-bred filly in her race, and the King Edward VII favourite carries a stamina question on the sire’s side. The Coronation is the honest blank — a race where the dam line looks like a signal but turns out to be a mirror of the runners’ own form. And the handicaps and the elite sprint are, as ever, for leaving alone. Wootton Bassett, for what it’s worth, remains the juvenile sire of the meeting, with Jolivette carrying the flag in the Albany.
All of it comes straight from the Smartform data: run the same figures yourself in daily_dams_insights and daily_sires_insights and you will see the same picture. As ever, this is analysis from one particular lens — a lens worth following race by race, win or lose.
Royal Ascot Day Three: What Smartform’s Breeding Data Says, Race by Race
By colin on Wednesday, June 17th, 2026Day three of the Royal meeting, and the same approach as ever: not tips, but what the Smartform breeding data makes of Thursday’s card — where the pedigrees point, and, just as often, where they don’t.
How Wednesday went
A mixed Wednesday, and a clarifying one. The two clean hits both came where the breeding and the market already agreed — and where the breeding was right to. Victorious, much the best Wootton Bassett profile in the Queen Mary, won as the favourite. And in the Prince of Wales’s the dam — the one maternal angle we’d said actually pays at this race — did just that: Ombudsman, the dam’s pick, won impressively; Minnie Hauk, one of our two price flags, chased him home at 15/2; and Daryz, the bare favourite the dam had nothing on, was held to third.
The race we’d built up, the Queen’s Vase, went the way the warning signs pointed and not the way the breeding did. Wareeth, the nick’s pick, trailed in near last; the race went to Limestone, a market leader the cross had no record for. On the morning of the race, reviewing the picks, we’d flagged two things the pedigree can’t see — a yard well below its usual form, and a price drifting hard on the exchange — and on the day those were the better guide. What we won’t do is claim the horse would have been good enough but for all that: a run that flat proves nothing either way, and the plain fact is the pick lost. It’s the lesson the whole series keeps making — breeding is a single lens, useful because it’s often underused, but it isn’t always the one that sees clearest.
The Windsor Castle was a plain miss to set beside it: the favourite Sergei Diaghilev, by the same Wootton Bassett who had obliged in the Queen Mary, could finish only ninth; our Dubawi overlay, Alfred Wallace, ran no race; and a 33/1 outsider won from a middling profile — though we had at least said to read that one with one eyebrow raised. The three we left alone — the Duke of Cambridge, the Royal Hunt Cup and the Kensington Palace — went as leave-alones should: two favourites and a 28/1 bolter, nothing the breeding data could have helped with.
For Day Three, the method is unchanged. It all comes out of Smartform’s breeding tables — daily_dams_insights and daily_sires_insights, which score every runner’s dam and sire line by distance and going — together with the experimental nicks layer we’ve been building, which looks at the cross of sire and damsire. Across thousands of past races we have worked out where breeding genuinely points to a winner and where it tells you nothing, and what follows is that work turned on the third day’s card.
One number throughout: PRB, percentage of rivals beaten, is our field-size-adjusted measure of how well a line’s runners have run on average. 0.50 is dead average; the further above, the better the typical run. It is steadier than strike-rate, which jumps about on small samples — and small samples are the thing to watch all week.
2:30 — Chesham Stakes (Listed, 7f, 2yo)
The juvenile race of the day, and a stouter test than the week’s earlier sprints. Run over seven furlongs, the Chesham tends to reward stamina-tinged two-year-olds who will keep improving — so we read the sires’ records at six and seven furlongs rather than at five-furlong speed. The market’s pick, Aix La Chapelle, is by Justify, who tops the field; but on the pattern we have seen all week, the favourite’s sire carries the flashier strike rate on the thinner sample. The deeper, steadier strong profile belongs to Frankel — a 24% record from a far larger book of runners — and his colts here, Pikachu and Romanza, are double-figure prices and bigger.
| Sire | Runs | Win % | PRB | This year’s runners (forecast) |
|---|---|---|---|---|
| Justify | 48 | 33.3 | 0.699 | Aix La Chapelle (2.50), Nola Soul (11.0), On Just Terms (26.0) |
| Frankel | 229 | 24.0 | 0.655 | Pikachu (21.0), Romanza (67.0) |
| Lope De Vega | 261 | 23.8 | 0.616 | Revels (11.0) |
| Sea The Stars | 117 | 18.8 | 0.604 | Sea Venture (5.50) |
| St Mark’s Basilica | 73 | 13.7 | 0.555 | South Dakota (13.0) |
| Sea The Moon | 121 | 9.1 | 0.515 | Time For The Moon (6.0), Whispering Moon (101.0) |
Sires’ two-year-old records at six and seven furlongs over the last five years. Justify’s 0.699 tops the field but rests on 48 runs against Frankel’s 229 — read the runs column alongside the figure. Forecast prices in decimal.
The sire confirms the favourite, as it has all week — but the better-evidenced strength is the Frankel colt the market is leaving alone.
3:05 — King George V Stakes (Heritage Handicap, 1m4f, 3yo)
A mile-and-a-half handicap for three-year-olds, and a competitive, well-bet one. Our handicap work is clear that in a hot, mid-class handicap the weights and the market between them wash out whatever the breeding sees; the residual edge survives only in the cheaper, less-exposed grades, which this is not. Sorts, but does not pay. Leave alone.
3:40 — Ribblesdale Stakes (Fillies’ Group 2, 1m4f, 3yo)
The fillies’ staying-distance Group race, and in theory the one where the dam line should have most to say. This year, though, the cupboard is close to bare. The dam samples are thin across the field, and the two at the head of the market give the lens almost nothing to read: Legacy Link’s dam has a single runner at the trip, Gilded Prize’s none at all. The only runner clearing even a four-run threshold with a strong figure is Johanna Walsh, at a price — and four runs is slender ground to stand on.
| Runner | Dam | Price | Runs | Wins | Win % | PRB |
|---|---|---|---|---|---|---|
| Johanna Walsh | Miss Aiglonne | 9.0 | 4 | 1 | 25.0 | 0.851 |
| Legacy Link (fav) | Chiasma | 2.62 | 1 | 0 | 0.0 | 0.875 |
| Brilliant Star | Star Catcher | 34.0 | 3 | 2 | 66.7 | 0.667 |
| Golden Orbit | Diploma | 26.0 | 13 | 1 | 7.7 | 0.572 |
| Gilded Prize (3.50), and most of the rest | no record at the trip | — | <1 | — | — |
The dam’s own runners at a mile and a half over the last five years. Note the runs column: Legacy Link’s eye-catching 0.875 is a single run, and most of the field has no record at the trip at all. Forecast prices in decimal.
Too thin to call — the dam lens can’t see enough here to back or to oppose, with Johanna Walsh the one speculative flag if you want one.
4:15 — Gold Cup (Group 1, 2m4f)
The staying showcase, and the nick at its fullest stretch — but read it differently from Wednesday’s Queen’s Vase. There, the runners were unexposed three-year-olds whose stamina was an open question, and the cross flagged one the market had overlooked. Here they are proven, exposed Cup horses whose stamina is long established and fully in the price, so the nick mostly confirms what the form book already shouts rather than unearthing anything new. And confirm it does: the cross lands emphatically on Trawlerman, by Golden Horn out of a Monsun mare, nine wins from thirteen at the trip — but Trawlerman is a known, top-class stayer, so that is the breeding agreeing with the obvious, not beating the market to it. The more useful observation, for a price, is that the nick rates both Trawlerman and Sweet William — a strong, deep staying record of its own — above the favourite, Scandinavia, whose cross is sound but a clear notch below the best here.
| Runner | Cross (sire × damsire) | Price | Runs | Wins | Win % | PRB |
|---|---|---|---|---|---|---|
| Trawlerman | Golden Horn × Monsun | 4.50 | 13 | 9 | 69.2 | 0.900 |
| Caballo De Mar | Phoenix Of Spain × Holy Roman Emperor | 11.0 | 5 | 1 | 20.0 | 0.844 |
| Sweet William | Sea The Stars × Shirocco | 9.0 | 19 | 6 | 31.6 | 0.810 |
| Miss Alpilles | Sea The Stars × Invincible Spirit | 67.0 | 24 | 5 | 20.8 | 0.687 |
| Al Nayyir | Dubawi × Manduro | 34.0 | 9 | 1 | 11.1 | 0.684 |
| Scandinavia (fav) | Justify × Galileo | 2.38 | 15 | 4 | 26.7 | 0.586 |
| Dubai Future | Dubawi × Street Cry | 26.0 | 6 | 2 | 33.3 | 0.567 |
| Al Riffa | Wootton Bassett × Galileo | 15.0 | 16 | 4 | 25.0 | 0.507 |
Each cross’s record in staying races (1m6f and beyond) over the last five years. Trawlerman’s 0.900 (13 runs) and Sweet William’s 0.810 (19) are the deep, trustworthy figures; Caballo De Mar’s 0.844 rests on just five runs and is best read as noise. Forecast prices in decimal.
The nick confirms the proven stayers over the favourite — but where the Queen’s Vase revealed, the Gold Cup only agrees. That contrast is the point: breeding earns its keep on the unexposed, not the proven.
4:50 — Britannia Stakes (Heritage Handicap, 1m, 3yo)
Another big-field mile handicap, and the same verdict as yesterday’s Royal Hunt Cup: breeding ranks the field perfectly respectably, then the field size and the weights wash the edge clean away by the line. Leave alone.
5:35 — Hampton Court Stakes (Group 3, 1m2f, 3yo)
A mile-and-a-quarter Group race, and a sire read in the Wolferton mould — though the middle-distance signal is a narrow one, the leading sires bunched, so take it as a soft lean rather than a firm call. What it says: Dubawi, much the best trip-sire on the deepest sample in the race, has Morshdi and Maho Bay at sevens and eights, while the favourite, Italy, is by Wootton Bassett — respectable at a mile and a quarter, but a notch below. The lens nudges gently towards the Dubawi pair and away from the market’s choice.
| Sire | Runs | Win % | PRB | This year’s runners (forecast) |
|---|---|---|---|---|
| Dubawi | 801 | 20.5 | 0.583 | Morshdi (7.0), Maho Bay (8.0) |
| Wootton Bassett | 498 | 13.3 | 0.530 | Italy (2.62), Endorsement (15.0) |
| Frankel | 1,165 | 17.2 | 0.529 | Oxagon (7.0) |
| Teofilo | 576 | 13.4 | 0.523 | Mountain Cat (15.0) |
| Kameko | 80 | 12.5 | 0.521 | Generic (9.0) |
| Too Darn Hot | 276 | 14.5 | 0.510 | Glacius (21.0) |
| Kingman | 714 | 12.6 | 0.507 | My Love Is King (11.0) |
Sires’ records at a mile and a quarter over the last five years. The figures are closely bunched, so this is a guide of degree, not a strong steer. Forecast prices in decimal.
A soft nudge to the Dubawi runners over the favourite — no more than that, in a race where the sires are closely matched.
6:10 — Buckingham Palace Stakes (Handicap, 7f)
A seven-furlong handicap to close the day, big and competitive. Sprint-to-mile handicaps of this kind are efficiently bet and give breeding no room to tell. Leave alone.
So that is Day Three. The week’s pattern holds: the sire keeps agreeing with the market in the juvenile races — Aix La Chapelle the latest favourite it confirms — while the genuine value, where there is any, sits with the well-evidenced overlay the market overlooks. And the Gold Cup makes the sharpest point of all: the same nick that flagged a double-figure shot in the Queen’s Vase can only nod along in a field of proven stayers. Breeding earns its keep where stamina is an open question, not where it is already on the board.
All of it comes straight from the Smartform data: run the same figures yourself in daily_dams_insights and daily_sires_insights and you will see the same picture. As ever, this is analysis from one particular lens — a lens worth following race by race, win or lose.
Royal Ascot Day Two: What Smartform’s Breeding Data Says, Race by Race
By colin on Tuesday, June 16th, 2026As yesterday: these aren’t tips. They’re what the Smartform breeding data makes of Wednesday’s runners, and we’re looking for value in the prices from a breeding perspective. The judgement on how to use that data, and any bet, stay yours.
How Tuesday went
A mixed day, told straight — and it opened almost too neatly. In the Coventry we said to side with the No Nay Never sire line, but that the figures could not tell you which of his four sons would come out on top, and that it needn’t be the favourite. So it proved: a No Nay Never colt won — Great Barrier Reef at 6/1 — while the 2/1 favourite Confucius, his own stablemate, could finish only sixth. The Wolferton went the same way: we flagged two breeding picks the market was overlooking and called the favourite vulnerable, and Map Of Stars, the second of the two, duly won at 13/2 while the co-favourite Haatem trailed in last. The fair caveat there is that our headline of the pair, Ancient Wisdom, was the one that ran flat.
In the Copper Horse, Paddy The Squire ran into third at 22/1 for an each-way return, and the speed-bred favourite Valiancy we were cool on never landed a blow — though Gamrai, the four-run profile we warned off on sample size, came second ahead of him. The St James’s Palace confirmation held exactly: the best-bred runner, Bow Echo, won — at 5/6, and with no value, just as we said it would be.
The one that got away was the one we made most of. In the Ascot Stakes, Mordor was towards the rear throughout and came home 15th of 20, the favourite Reaching High finished last, and the race fell to a 25/1 winner our staying-cross table had nothing on. The showcase handicap simply misfired — a plain miss on the race we talked up hardest.
The method is the same throughout. It all comes out of Smartform’s breeding tables — daily_dams_insights and daily_sires_insights, which score every runner’s dam and sire line by distance and going — together with an experimental nicks layer we’ve been building that looks at the cross of sire and damsire. Across thousands of past races we have worked out where breeding genuinely points to a winner and where it tells you nothing, and what follows is that work turned on the second day’s card.
One number to keep in mind throughout: PRB, percentage of rivals beaten, is our field-size-adjusted measure of how well a sire’s or dam’s runners have run on average. 0.50 is dead average; the further above, the better the typical run. It is steadier than strike-rate, which jumps around on small samples — and small samples are the thing to watch all week.
2:30 — Queen Mary Stakes (Fillies’ Group 2, 5f, 2yo)
A juvenile sprint, so — as in yesterday’s Coventry — it is almost entirely the sire’s story, and one sire towers over the rest: Wootton Bassett, with very nearly a winner in four of his runners over the trip on much the biggest sample in the field. His filly here is Victorious, and she is also the odds-on favourite. So once again the breeding backs the market rather than overturning it. Sioux Nation, sire of the second favourite Alta Regina and two others, heads the next tier.
| Sire | Runs | Win % | PRB | This year’s runners (forecast) |
|---|---|---|---|---|
| Wootton Bassett | 342 | 24.9 | 0.683 | Victorious (1.91) |
| Lucky Vega | 105 | 13.3 | 0.592 | Kentucky Rain (34.0) |
| Havana Grey | 882 | 15.5 | 0.565 | Big Negotiator (17.0), Havana Lightning (26.0), Shimmering Sun (51.0) |
| Sioux Nation | 479 | 15.7 | 0.557 | Alta Regina (4.33), Drazinda (8.5), Velozee (34.0) |
| Starspangledbanner | 743 | 12.4 | 0.544 | Senorita Bonita (6.0) |
| Mehmas | 1,155 | 12.5 | 0.533 | Wild Blossom (13.0) |
| Kodiac | 1,103 | 12.4 | 0.520 | Love A Giggle (8.5) |
Leading, well-sampled profiles shown. One-run sires (such as Celtic Dispute’s, which posts a flattering 0.905 off a single runner) are left out as noise. Forecast prices in decimal.
Reading the columns. Runs is how many of that sire’s runners we have in five- to seven-furlong two-year-old races over the past five years — the weight of evidence behind the figure; Win % is how often they won; PRB as above.
The figures agree with the market — and point, in passing, to the juvenile sprint sire of the meeting.
3:05 — Queen’s Vase (Group 2, 1m6f, 3yo)
The most interesting race on the card for us, and the one where our work has the firmest ground under it. The Queen’s Vase is a top-class staying race run at level weights — no handicapper to claw the best horse back — by three-year-olds being asked to stay a mile and six for the first time. Their own form, gathered over shorter trips, cannot tell you whether they get the distance. The breeding can, and across several hundred staying races we have shown the “nick” — the cross of sire and damsire — to be a genuine guide to which of them will.
This year it could hardly be clearer. Wareeth, by Sea The Stars out of a Motivator mare — two of the stoutest influences going — is the only runner whose cross has a real staying record, and it is a striking one: five wins from seven at the trip. At around 11/1 he is not the market’s pick. The two at the head of the betting, Galiyan and Limestone, have crosses with no staying record to read at all — their stamina is unproven on the page as much as on the track.
| Runner | Cross (sire × damsire) | Price | Runs | Wins | Win % | PRB |
|---|---|---|---|---|---|---|
| Wareeth | Sea The Stars × Motivator | 12.0 | 7 | 5 | 71.4 | 0.824 |
| Ranga Tang | Lope De Vega × Dalakhani | 51.0 | 5 | 0 | 0.0 | 0.399 |
| Galiyan (fav), Limestone, and the rest | cross untried at the trip | — | <4 | — | — |
Only crosses with at least four runs at 1m6f or beyond in the last five years can be read; every other runner’s cross is untried over the trip. Forecast prices in decimal.
Reading the columns. Runs and Wins are that exact sire-and-damsire cross’s record in staying races (1m6f and beyond) over the last five years. A dash means the cross has fewer than four staying runs — too little to read, which in this race is most of the field.
The nick points firmly to Wareeth, and to a stamina question mark over the favourites. A confident lean rather than a lock — it rests on seven runs — but this is exactly the race the signal is built for.
A note, at 10am on Wednesday. The concerns here aren’t breeding ones — Archie Watson’s yard is running below its usual level, and on Betfair the horse has drifted sharply, out to around 20/1 from an overnight 12/1 — but our lens is breeding alone, and on that the horse itself rates as strongly as anything on the card.
3:40 — Duke Of Cambridge Stakes (Fillies’ & Mares’ Group 2, 1m)
The fillies’ answer to yesterday’s Queen Anne, and the same verdict: exposed older milers in a sharp market, with nothing in the pedigrees the betting has not already counted. One to leave alone.
4:20 — Prince Of Wales’s Stakes (Group 1, 1m2f)
One of the few races where the dam’s side has historically not just named the winner but offered a price for it. At a mile and a quarter, a mare’s record as a producer carries real weight, and here it does proper work. It backs last year’s winner, Ombudsman (his dam four wins from seven at the trip), to the hilt — but, tellingly, it has nothing to say for the bare favourite Daryz, whose dam has barely a runner to her name at this level. And at longer prices it likes Minnie Hauk and Almaqam, both out of mares with strong middle-distance records.
| Runner | Dam | Price | Runs | Wins | Win % | PRB |
|---|---|---|---|---|---|---|
| Ombudsman | Syndicate | 2.38 | 7 | 4 | 57.1 | 0.933 |
| Minnie Hauk | Multilingual | 12.0 | 6 | 5 | 83.3 | 0.889 |
| Almaqam | Talmada | 7.5 | 11 | 5 | 45.5 | 0.875 |
| Mississippi River | Cursory Glance | 201.0 | 10 | 3 | 30.0 | 0.688 |
| See The Fire | Arabian Queen | 21.0 | 19 | 6 | 31.6 | 0.645 |
| Devil’s Advocate | Precious Ramotswe | 151.0 | 14 | 3 | 21.4 | 0.569 |
| Dancing Gemini | Lady Adelaide | 34.0 | 5 | 0 | 0.0 | 0.279 |
| Daryz (fav) | Daryakana | 2.25 | 1 | 0 | 0.0 | 0.000 |
The dam’s own runners in mile-and-a-quarter-ish races (1m1f–1m4f) over the last five years. Dam samples are smaller than sire samples by nature, so weigh the runs column accordingly. Forecast prices in decimal.
The dam confirms Ombudsman and queries Daryz — and, for those wanting a price, flags Minnie Hauk and Almaqam.
5:00 — Royal Hunt Cup (Heritage Handicap, 1m, ~30 runners)
Our textbook case of breeding sorting a field without being able to win it. In a thirty-runner mile handicap the figures will rank the runners perfectly respectably, but the weights and the sheer size of the field wash any edge clean away by the line — we have measured it doing exactly that, year after year. Sorts, but does not pay. Leave alone.
5:35 — Kensington Palace Stakes (Fillies’ & Mares’ Handicap, 1m)
The same race in all but name — a big-field mile handicap, this time for fillies and mares. The same verdict follows. Leave alone.
6:10 — Windsor Castle Stakes (Listed, 6f, 2yo)
Back to the juvenile sprinters, and back to the sire — though this is a race that has flattered to deceive on small samples before, so we read it with one eyebrow raised. The good news is the leading profiles here are deep ones. Wootton Bassett tops the list again, which makes him the sire of the favourite in both of the day’s two-year-old sprints — the juvenile sire of the meeting, plainly. His colt Sergei Diaghilev is the favourite. The one the breeding rates well above its price is Alfred Wallace, by Dubawi — a 23.6% strike-rate profile on 300-plus runs, available at around 20/1.
| Sire | Runs | Win % | PRB | This year’s runners (forecast) |
|---|---|---|---|---|
| Wootton Bassett | 342 | 24.9 | 0.683 | Sergei Diaghilev (2.62), Boleto (26.0) |
| Dubawi | 301 | 23.6 | 0.665 | Alfred Wallace (21.0) |
| Bayside Boy | 16 | 31.3 | 0.659 | Sale Shark (9.0), Our Boy Bailey (26.0) |
| Night Of Thunder | 330 | 21.2 | 0.610 | Controlla (5.5) |
| St Mark’s Basilica | 91 | 13.2 | 0.536 | King Of Cloughan (21.0) |
Leading profiles; deep samples preferred. Bayside Boy’s eye-catching 31.3% rests on only sixteen runs, so treat it with caution; one-run sires are left out. Forecast prices in decimal.
The favourite has the best engine again; Alfred Wallace is the one the breeding fancies more than the market does.
So that is Day Two. Two of the day’s three short-priced two-year-old favourites are by the same sire, Wootton Bassett, and the breeding simply nods along with the market in both; the older milers and the big mile handicaps are races to leave well alone. The day belongs to the Queen’s Vase — a Class 1 staying race at level weights is precisely where our work has its firmest footing, and this year it has handed us a clear one in Wareeth.
All of it comes straight from the Smartform data: run the same figures yourself in daily_dams_insights and daily_sires_insights and you will see the same picture. As ever, this is analysis from a very specific lens — a lens worth following race by race, win or lose.
Royal Ascot Day One: What Smartform’s Breeding Data Says, Race by Race
By colin on Monday, June 15th, 2026First, what this is. These aren’t tips. They’re what the Smartform breeding data makes of Tuesday’s runners, looking for value in the prices from a breeding perspective.
It all comes out of Smartform’s breeding tables — daily_dams_insights and daily_sires_insights, which score every runner’s dam and sire line by distance and going — together with an experimental nicks layer we’ve been building that looks at the cross of sire and damsire. We’ve run the same measures back over thousands of past races to see where breeding genuinely points to a winner and where it tells you nothing. What follows is that work turned on the racecard for the opening day.
The short version of what it shows: breeding pays its way where horses are free to show their class, it only echoes the market in the big championship races, and it counts for little to nothing in the elite sprints. Here is Day One in that light, with the races to leave alone marked as plainly as the ones with an angle.
2:30 — Queen Anne Stakes (Group 1, 1m)
The older milers open the meeting, and it is a quiet start for the breeding. These are thoroughly exposed horses in a tight, well-judged market — there is nothing in their pedigrees the betting has not already weighed. One to leave alone.
3:05 — Coventry Stakes (Group 2, 6f, 2yo)
The first race where breeding really has a say, because with sprinting two-year-olds at the Royal meeting we have found it is almost all down to the sire. And the sire to be on for a juvenile sprint is No Nay Never, comfortably the most precocious in the field on much the largest sample.
But here is the complication: this is a sire’s record, not a horse’s, and No Nay Never has four runners in the race — from the forecast favourite, Confucius, all the way out to a 51.0 outsider. The figure tells you which stallion to side with, not which of his sons; the market separates the four on what it has seen on the racecourse, which the sire record cannot. So it is less “back the favourite” than “the favourite has the right sire — and so do three others at much longer prices.” Calyx, himself a Coventry winner, is the next profile worth respect from a win strike rate perspective.
| Sire | Runs | Win % | Sire PRB | This year’s runners (forecast) |
|---|---|---|---|---|
| No Nay Never | 694 | 18.4 | 0.596 | Confucius (2.50), Great Barrier Reef (6.0), God Given Talent (21.0), Easy Answer (51.0) |
| Lucky Vega | 105 | 13.3 | 0.592 | Night In Vegas (7.5) |
| Calyx | 193 | 17.1 | 0.579 | The Scallionator (26.0), High King (26.0) |
| Sioux Nation | 479 | 15.7 | 0.557 | Siouxperb (11.0), Final Objective (51.0) |
| Blue Point | 534 | 12.9 | 0.549 | Royal Heritage (13.0) |
| Starspangledbanner | 745 | 12.3 | 0.544 | Cut A Dash (15.0) |
| Mehmas | 1,159 | 12.4 | 0.532 | Ruler’s Pride (9.0), Adaay Of Scarlett (21.0), Mrair (21.0), The Ginger Kid (26.0), Bull Shark (51.0) |
| Arizona | 86 | 3.5 | 0.382 | Arizona Raider (51.0) |
No Nay Never’s four runners share one figure, because the record belongs to the sire, not the horse. Leading profiles shown; a few smaller-sample sires are left out for space. Forecast prices in decimal.
Reading the columns. Runs is how many of that sire’s runners we have in five- to seven-furlong two-year-old races over the past five years — the weight of evidence behind the figure. Win % is how often they won. PRB, percentage of rivals beaten, is our field-size-adjusted measure of how well they ran on average: 0.50 is dead average, and the further above it, the better the typical run. It is the steadier of the two, since strike-rate jumps around on small samples.
The sire points to a No Nay Never colt — which of the four is a question for the form, not the breeding.
3:40 — King Charles III Stakes (Group 1, 5f)
Our pedigree analysis tells us that this is the clearest leave-alone on the card. In a top-class five-furlong sprint the fastest horse wins whatever its breeding, and pedigree tells you little that the clock does not. Move on.
4:20 — St James’s Palace Stakes (Group 1, 1m, 3yo)
A race the dam’s side sorts very well — and also one that names the winner while offering little on the price. The best-bred runner, Bow Echo, is the one the market has already made odds-on. The breeding and the bookmakers are looking at the same horse. Something to note, not something to back.
5:00 — Ascot Stakes (Heritage Handicap, 2m4f)
The race we have spent most time on. Across several hundred top staying races we found that the “nick” — how a sire’s stock perform when their dam’s sire is a particular stallion — is a genuine, measurable guide to which horse may run well over a marathon trip. In a handicap the only question is whether the weights allow that to become a win.
This year the stoutest selection is Mordor, by Roaring Lion out of a Cape Cross mare — a cross with a real two-mile-plus record behind it, three wins from eight runs at the trip — and at a double-figure price the figures prefer it to the favourite, Reaching High, whose own stamina pedigree is sound but whose record is variable. Mordor is just the sort this measure is built to find: bred to stay, priced as though it might not. One to be with rather than to trust blindly — it is a handicap, and the handicapper still has his say.
| Runner | Cross (sire × damsire) | Price | Runs | Wins | Win % | PRB |
|---|---|---|---|---|---|---|
| Mordor | Roaring Lion × Cape Cross | 12.0 | 8 | 3 | 37.5 | 0.789 |
| Puturhandstogether | Caravaggio × Galileo | 8.0 | 5 | 1 | 20.0 | 0.584 |
| Westminster Moon | Sea The Moon × Oasis Dream | 11.0 | 7 | 1 | 14.3 | 0.559 |
| Reaching High (fav) | Sea The Stars × Monsun | 2.88 | 22 | 3 | 13.6 | 0.523 |
| Comfort Zone | Churchill × Mastercraftsman | 26.0 | 8 | 1 | 12.5 | 0.545 |
| Glenroyal | Australia × Montjeu | 26.0 | 11 | 1 | 9.1 | 0.314 |
| Barnso | Belardo × Azamour | 17.0 | 5 | 0 | 0.0 | 0.517 |
| Lavender Hill Mob | Expert Eye × Daylami | 51.0 | 4 | 0 | 0.0 | 0.333 |
Only crosses with at least four runs at 1m6f or beyond in the last five years are shown — the rest of the field is too lightly raced over the trip to read anything into. Ranked on strike-rate, PRB alongside. Forecast prices in decimal.
Reading the columns. Runs and Wins are that exact sire-and-damsire cross’s record in staying races (1m6f and beyond) over the last five years; Win % follows from them. PRB is again percentage of rivals beaten — 0.50 average, higher better — and on a short record it is the more reliable of the two, which is why Mordor’s standout 0.789 matters as much as its strike-rate, while Reaching High’s deep sample of 22 runs earns its place near the top of the market even on a plainer figure.
5:35 — Wolferton Stakes (Listed, 1m2f)
The day’s real value angle. Over a mile and a quarter a sire’s record at the trip carries weight, and it points firmly to Ancient Wisdom — by Dubawi, much the strongest middle-distance sire in the race, better than one winner in five at this trip — yet available in double figures while the market sides with Haatem at the head of the betting. Map Of Stars, by Sea The Stars, has the next-best profile and is another double-figure price. The breeding rates the two the market overlooks, and this is the race where that has tended to pay. Worth an each-way look.
6:10 — Copper Horse Stakes (Handicap, 1m6f)
The other staying handicap, and the nick is busy here too. Top of the raw list is Gamrai, a winner of half its starts at the trip — but off only four runs, far too few to lean on, and we have been caught by small-sample flashes often enough to know better. The one with real evidence behind it is Paddy The Squire, by the Derby winner Golden Horn out of a Galileo mare — about as stoutly bred as you will find, six wins from thirty-six at the distance, and a 20/1-plus chance. Tellingly, the figures are lukewarm on the favourite, Valiancy, whose Cracksman–Dutch Art breeding leans towards speed and middle distances rather than true stamina, and who has barely been asked to stay. Another race where the nick turns up a price, with the usual handicap caveat.
So that is the shape of Day One. Leave the sprints and the exposed milers alone; note that the breeding is only agreeing with the market in the Coventry and the St James’s Palace; and look to the two staying handicaps and the Wolferton for the angles with something behind them. Breeding is a real edge where it has room to tell — the trick, as always, is knowing which races those are.
All of it comes straight from the Smartform data: run the same figures yourself in daily_dams_insights and daily_sires_insights and you will see the same picture. And to say it plainly once more — this is analysis from a very specific lens that will be interesting to follow.
The Epsom Classics Through Two Lenses: How Far Can Pedigree Statistics Take You?
By colin on Friday, June 5th, 2026Yesterday’s dam-table release completed Smartform’s pedigree picture. So we built two models of the Epsom Classics — one using everything, one using breeding alone — and asked how much of the picture pedigree can paint on its own.
With yesterday’s release of daily_dams_insights, the Smartform pedigree canon is now three deep: daily_sires_insights, the new daily_dams_insights, and the sire × damsire cross, which only exists because the native database carries damsire references for every horse. Thus a complete picture, paternal and maternal, is queryable for every UK and Irish runner since 2008: the production form of a runner’s sire, dam, damsire and breeding cross, across aggregate, recent, age-, distance-, course- and condition-specific lenses, in both PRB and strike rate.
The Epsom Classics are the natural place to test it. The Oaks and Derby are the deepest mid-distance Classic trials in the calendar — top-of-pyramid three-year-old Group 1s over twelve furlongs, where any stamina and Classic-distance signal in the breeding should be doing its hardest work — and they come with a tightly bounded sample (18 useful runnings since our pedigree data starts in 2008), which makes it tractable to ask exactly which signals move the needle.
So we ran a two-model experiment. A full model uses everything we hold — pedigree plus jockey, trainer and the runner’s own prior form. A parallel pedigree-only model sets the form and connections aside and keeps only the pedigree features: sire, dam, damsire and the breeding cross. The question: how much of the full model’s predictive power survives that restriction?
The short answer is most of it — and on the Oaks, all of it. The pedigree-only model is a genuine second opinion in its own right, not a stripped-down copy of the full one. And whether the two models agree or disagree turns out to be more useful than either on its own.
Why a composite, not a black box
Eighteen runnings is no place for a hundred-feature gradient booster; throw that much at this little data and you model noise. We needed something simpler and more honest. For every candidate stat — 138 in all, every variant across sire, dam, damsire and the breeding cross, plus jockey, trainer and self prior form for the full model — we take its Spearman rank correlation with finishing position across the cohort. The strongest discriminators become the features; each one’s weight is its signed Spearman value. A runner’s score is its z-score on each weighted stat, summed and softmaxed within the race.
To check it generalises, we ran leave-one-year-out across 2008–2025: hold out each year, refit the weights on the other seventeen, score the held-out race. That gives eighteen genuinely out-of-sample predictions per Classic, per model.
What the data picks — and what it ignores
We let the data choose from the whole arsenal. What rose to the top was sire and dam. The damsire and the breeding cross, on this sample, didn’t reach the top tier of discriminators at all — which is itself worth knowing: at the very top of the mid-distance pyramid, it is the direct sire and dam lines that carry the signal. Having the full picture is precisely what let us find that out.
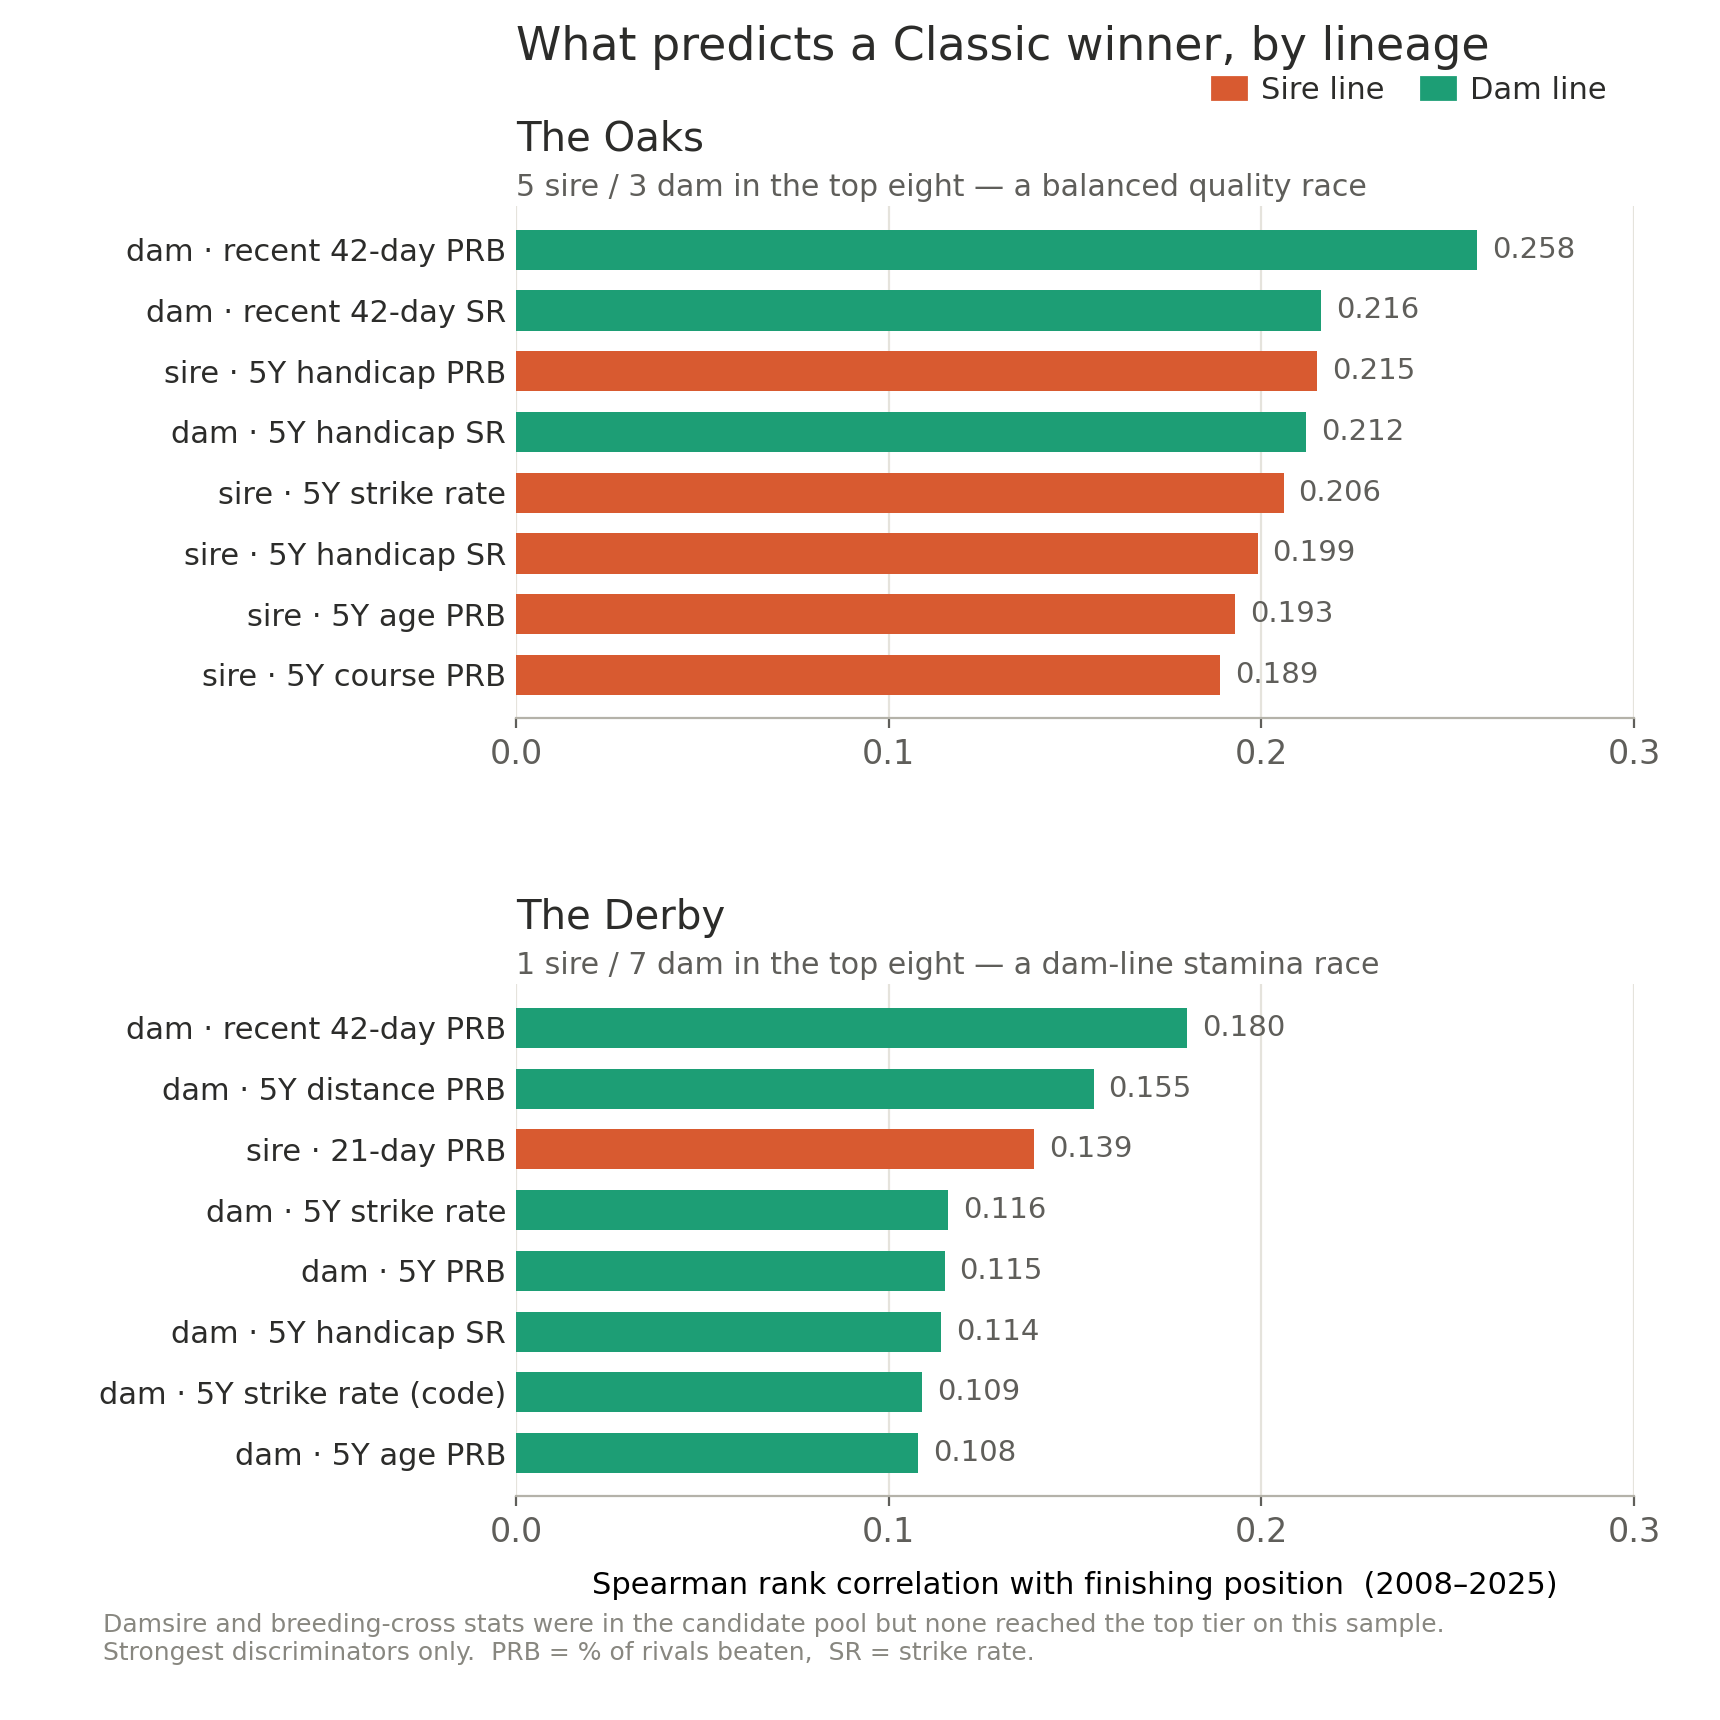
Top breeding discriminators for each Classic, coloured by lineage. The Oaks profile is balanced; the Derby’s is almost entirely dam-led.
Two patterns fall out. The Oaks is balanced — five sire stats and three dam stats in the top eight, the dam contributing recency (42-day progeny form) and the sire contributing five-year quality (strike rate, age- and condition-PRB). It reads as a quality race. The Derby is overwhelmingly dam-led — seven of the top eight are dam stats, with the dam’s five-year progeny PRB at twelve-furlong distances the second-strongest of all the Derby signals; the sire appears only through its last-three-weeks form, not any aggregate. It reads as a stamina race.
One honest caveat sits behind both profiles. The strongest single discriminator in each race is the dam’s 42-day progeny PRB — and for a dam with only a handful of foals, the progeny runs inside a 42-day window are usually little more than the runner’s own last one or two starts. So while the model carries no explicit form, jockey or trainer features, its top signal is in practice a proxy for the horse’s own recent form, arriving through the dam column rather than a form one.
A second caution, on sample size: among the Derby signals, one shows a positive rank correlation but a negative top-versus-bottom-quartile lift. These are eighteen-race rankings, not laws of nature.
How both models held up over 18 years
| Top-1 hits | Top-3 hits | Mean winner rank | |
|---|---|---|---|
| Oaks — full | 3 / 18 (17%) | 9 / 18 (50%) | 4.4 |
| Oaks — pedigree | 3 / 18 (17%) | 9 / 18 (50%) | 5.0 |
| Derby — full | 2 / 18 (11%) | 7 / 18 (39%) | 5.9 |
| Derby — pedigree | 2 / 18 (11%) | 5 / 18 (28%) | 6.7 |
On the Oaks the pedigree-only model matches the full one outright — same 50% top-3 rate, same 17% of winners found outright. That parity isn’t quite magic: its two strongest Oaks features are both 42-day dam stats, recent self-form in disguise, so it is quietly leaning on the same recent-form signal the full model uses openly. On the Derby it gives up ground (top-3 falls from 39% to 28%) but still finds the winner outright in 2 of 18 renewals — and here the work is done by genuine aggregate dam stamina, not the recency proxy. That’s a strong showing for a model that deliberately sets aside the form and connections factors that do most of the full model’s work, and leans on breeding alone.
More interesting is where the two models agree on the winner:
| Verdict | Count |
|---|---|
| Both models had the winner in their top-3 | 8 / 36 (22%) |
| Only the full model did | 8 / 36 (22%) |
| Only the pedigree model did | 6 / 36 (17%) |
| Neither | 14 / 36 (39%) |
At least one model lands the winner inside its top-3 in 22 of 36 Classics — 61%. Read that with care: a combined six-horse shortlist is a sizeable slice of a Classic field, so the fair comparison is against the market’s own shortlist rather than treating 61% as a standalone edge. The genuinely useful point is that the two books rarely both miss, and that the split between them is informative.
That split is the structural takeaway. On the Oaks the two models agree on the winner in 7 of 18 years (39%) — Snowfall (2021), Anapurna (2019) and Minding (2016) among them, all heavily fancied Coolmore winners with clean pedigree credentials and good form. When both books light up the same Oaks runner, you have a high-confidence pick. On the Derby they agree only once in 18 years (Ruler of the World, 2013). The Derby winner is almost always found by one model and missed by the other: Pour Moi (2011) caught by pedigree alone and missed by the full model; Auguste Rodin (2023) the reverse. That asymmetry is the argument for running both books in parallel rather than averaging them — they draw on genuinely different signal, and which one dominates depends on the race.
The 2026 read
With the weights refit on the full 2008–2025 set (for live scoring there is nothing left to hold out), here is how this year’s declarations score. These are model outputs, not tips — and as the section below makes clear, the models don’t see everything.
Oaks (Friday). Pedigree top three: A La Prochaine, Legacy Link, Sugar Island. Full top three: Amelia Earhart, Legacy Link, A La Prochaine. Both books share Legacy Link (the market favourite) and A La Prochaine (the value-tilted version of the same signal) — the high-confidence Oaks shape. Amelia Earhart is the full model’s standalone pick, on form and connections that pedigree alone can’t see; Sugar Island is the pedigree model’s standalone pick, on Coolmore breeding the form view under-weights.
Derby (Saturday). Pedigree top three: Item, Maltese Cross, Christmas Day. Full top three: Benvenuto Cellini, Item, Maltese Cross. Item is the only horse in both books’ top three — the rare Derby-agreement shape that has appeared just once in eighteen holdout years. Benvenuto Cellini is the full model’s standalone pick; Christmas Day is the pedigree model’s, and the biggest market overlay of the lot.
Each of those standalone shapes has produced Classic winners before — and missed plenty too. The honest guide to how often is the hit-rate table above, not the handful of names that happened to win.
What we wouldn’t do. Both models rate Pierre Bonnard and Ancient Egypt as Derby outsiders, and since pedigree alone dislikes them too, it isn’t a form-versus-breeding artefact. But the market knows things our entity-stat snapshots — taken 24 to 48 hours out — don’t: going, late money, stable information. We’ve flagged the disagreement; we wouldn’t oppose them on it.
What it tells us about the data
The finding isn’t that pedigree alone is as good as pedigree plus form — on the Derby it gives up about ten points of top-3 hit rate. It’s that it gives up far less than you’d expect from a model that sets aside the form and connections data entirely, and on the Oaks it gives up nothing at all. That makes pedigree-only modelling a viable second opinion on the Classics, not a poor relation of the form-based view — and it’s the new dam table that completes the picture and gives that view its backbone. When the two books agree, you have a high-confidence pick; when they split, the split itself tells you whether the case is breeding-led or form-led.
Our own reading leans on the breeding — it is, after all, what the new dam table now lets us see most clearly. In the Oaks that points to A La Prochaine, with Sugar Island the pure-breeding flyer; in the Derby, to Item ahead of Christmas Day, the biggest breeding-led overlay or value pick on the card. And it isn’t at odds with the full model where it counts: both books land A La Prochaine and Legacy Link in the Oaks, and both land Item in the Derby — the overlaps where confidence is highest.
— Betwise / Smartform