
New: Daily Sire Insights – How Today’s Runner Fits the Sire’s Patterns
By colin on Saturday, May 2nd, 2026Introduction
Following on from the recent introduction of Daily Trainer Stats, we’ve extended the same approach to another key area of racing analysis: sire statistics and top performing patterns within the history of each sire’s progeny. Both views are now integrated within a single race view, Daily Trainer & Sire Insights from the top menu on the Betwise website.
The objective is the same – to show Smartform sire data within the context of today’s runners on a race-by-race basis.
For users of Smartform, the full history of sire performance is already available, with data going back to 2008 and covering a wide range of conditions. That level of detail supports deep analysis, model building and backtesting, as well as daily statistics and systems.
Daily Sire Stats complements that by providing a visual, sortable view of how those patterns apply to today’s races, but with a new feature that allows one aspect of sire behaviour to be surfaced clearly – how a sire’s progeny have performed across the spectrum of going.
Built on Smartform: the daily_sires_insights table
As with Daily Trainer Stats, this feature is built on the underlying Smartform data.
In this case, it draws from the daily_sires_insights table, which contains engineered statistics for every runner since March 2008. This dataset summarises how each sire’s progeny have performed across a wide range of conditions, including:
- course and distance
- race type and code
- age group and handicap status
- and multiple timeframes (5-year, 42-day, 21-day)
All figures are calculated on a “to date” basis, meaning they reflect only what would have been known at the time of each race. This makes the data suitable for both live use and historical testing.
On its own, this provides a comprehensive statistical view of sire performance.
But, as with trainer data, a table of figures only tells part of the story in terms of identifying patterns within a sire’s own performance history.
The importance of going
Going is one of the more fundamental influences in racing but one of the most difficult to nail in terms of quantifying its effect. There are several reasons for this, largely to do with how going is measured and reported (more on that shortly). But from a racing record perspective alone, an individual runner rarely shows enough evidence to demonstrate how well or otherwise it handles a certain type of going. If a horse has never raced on extreme going, how do we know if it will handle it? If one race has been run on heavy going and the horse puts in a poor performance, is that enough evidence to say that it doesn’t handle heavy conditions?
On the other hand, it is well understood that horses inherit physical traits from their sire — including aspects of conformation and galloping action — which in turn can influence how they perform under different ground conditions.
This means that going preferences are often reflected consistently across a sire’s progeny, which gives us a much larger data sample from which to infer going preferences:
- For lightly raced horses, where the runner itself may not yet have established any clear profile, this can provide an essential layer of insight.
- And for more exposed runners, it can highlight how they may perform under conditions they have not previously encountered.
Handling the Uncertainty of Going
One of the main challenges in presenting sire data is how to handle going conditions in a meaningful way. We can create a statistic similar to age or recent form that classifies the particular strike rate (or percentage of rivals beaten) for a particular going type that corresponds to past results, however there are limitations to using a single figure since:
- going can change on the day
- pre-race descriptions are not always reliable
- And most importantly a single summary figure that is fixed to one type of going (e.g. Good to Soft) does not provide insight into the sire performance pattern across the range of going, especially adjacent categories such as Good or Soft
A different approach: visualising the full picture
Instead of relying on a single number, Daily Sire Stats uses a similar framework to trainer patterns:
👉 a full distribution of historical performance
But in this case, grouped by:
• going
• and distance bands
Each box plot shows how a sire’s progeny have performed under those conditions, using % rivals beaten (PRB).
And then, for today’s race:
👉 the current runner is placed directly into that distribution (highlighted in red)
This is the key step.
Instead of asking:
“Is this sire good on soft ground?”
You are looking at:
👉 how the sire performs across different goings — and where today’s runner sits within that range
What the Feature Shows – a worked example
For every race, you are presented with:
• A sortable table of sire statistics
• And a set of box plots underneath, specific to each sire
Here we’re looking at the 14.20 from the start of the Guineas meeting (yesterday as we write this post). The table provides a structured overview that can be sorted by a range of different statistics. Here sorted by Mean PRB for the age, going and distance bands (the first metric).
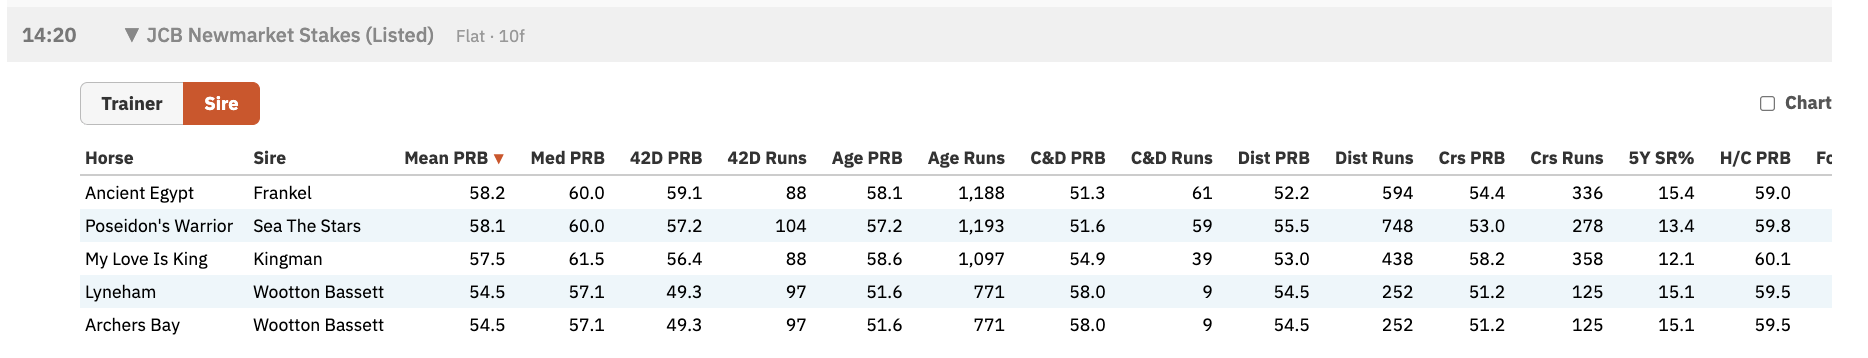
The charts then extend this by showing how those numbers behave in context.
Below the table, each sire has a set of box plots showing how their progeny have performed historically. See the screenshot for the charts (which can be toggled on or off from the main table):
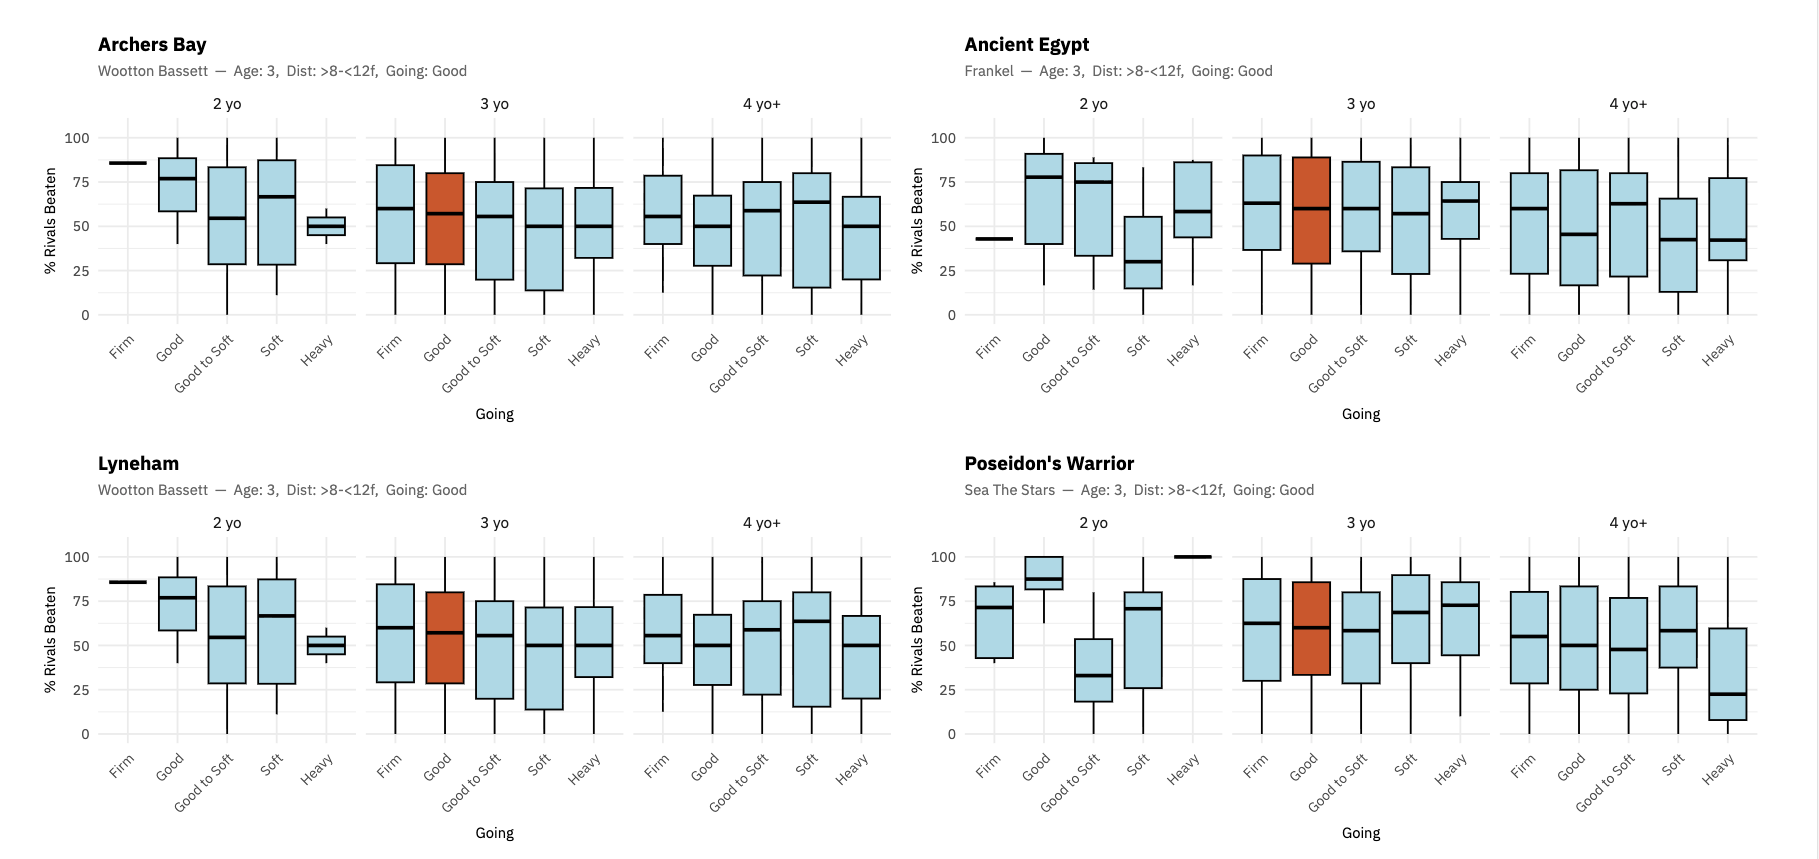
These are grouped by:
• Going
• Distance
Each box shows the distribution of % rivals beaten (PRB) for that sire under those conditions.
And then, for today’s race:
👉 the current runner is placed directly into that distribution
How To Read The Charts
You don’t need to overcomplicate it.
Each box gives you three useful pieces of information:
• The median line → typical level of performance
• The height of the box → how consistent that performance is
• The whiskers → how wide the range of outcomes is
The data on sires (particularly first or second season sires) is sometimes sparse, so interpret with care. However, as with this example, when the data is robust and there is a top rated performance, the signal can be very useful and gives us an interesting perspective that is often ignored.
In early season races, where the key question is often how well horses have trained from the previous year, the sire stats help assess the chances of all runners — and in this case highlighted the big-priced winner Ancient Egypt as top ranked. In answer to the question “Do progeny of Frankel train on from two to three?” the sire stats strongly support that view. The going, age and distance band stats answer the question: “Do progeny of Frankel perform under these conditions?” And the best thing – you get to see that relative to all the other runners in the race.
Used alongside trainer patterns, this helps build a more complete picture of how a race is likely to shape up. This is where the feature becomes practical — not just describing sire behaviour, but applying it directly to race analysis.
For now, Daily Sire Stats is available to all members, so you can explore the feature and see how it fits into your own approach.
Over time, it may become part of the subscriber-only offering, but for now it is there to be used and assessed in real conditions.