
New: daily_dams_insights Table Now in Smartform
By colin on Thursday, June 4th, 2026The maternal-line counterpart to our sires table is now available to download — and it lands on the eve of the Epsom Derby meeting, which is no accident.
Following on from last year’s release of daily_sires_insights, we’re pleased to add its natural counterpart to Smartform: daily_dams_insights — the same engineered statistics, viewed down the female line.
The schema is an exact mirror of the sires table. Anything you’ve already built against daily_sires_insights will run against dams with simple field-name substitutions (sire_id → dam_id, sire_name → dam_name, and so on). One row per declared runner, per race, per day; the dam’s other progeny’s prior performance summarised across nine stat groups and four metrics, every aggregate computed strictly from races run before the row’s meeting_date — so it’s feature-correct for any modelling you put it to, with no leakage from the future.
How it sits alongside the sires table
Sire statistics are widely used, and rightly so: coverage is near-total, the samples are large, and a version of them sits in just about every racecard and form product, though the advantage with Smartform remains being able to manipulate them programmatically. The flip side of that ubiquity is that much of what the sire figures tell you is more likely to be reflected in the market already.
The dam line is the opposite proposition. It is half of every runner’s genetic makeup, yet it is rarely queried systematically, and — as the figures below show — it is sparser and noisier than the sire equivalent. That reads like a list of drawbacks; however, it is also the profile of a signal that may still have something left to give: overlooked, under-covered, and seldom mentioned in the form commentary.
What to expect from coverage
We’d rather you see the limits up front than discover them later, so we ran a full coverage audit. Two pictures tell most of the story.
A stallion can cover well over a hundred mares a season; a mare produces roughly one foal a year. That biology shows up directly in the data — there are 20× more distinct dams (71,684) than sires (3,566), but each dam has far fewer offspring to summarise over.
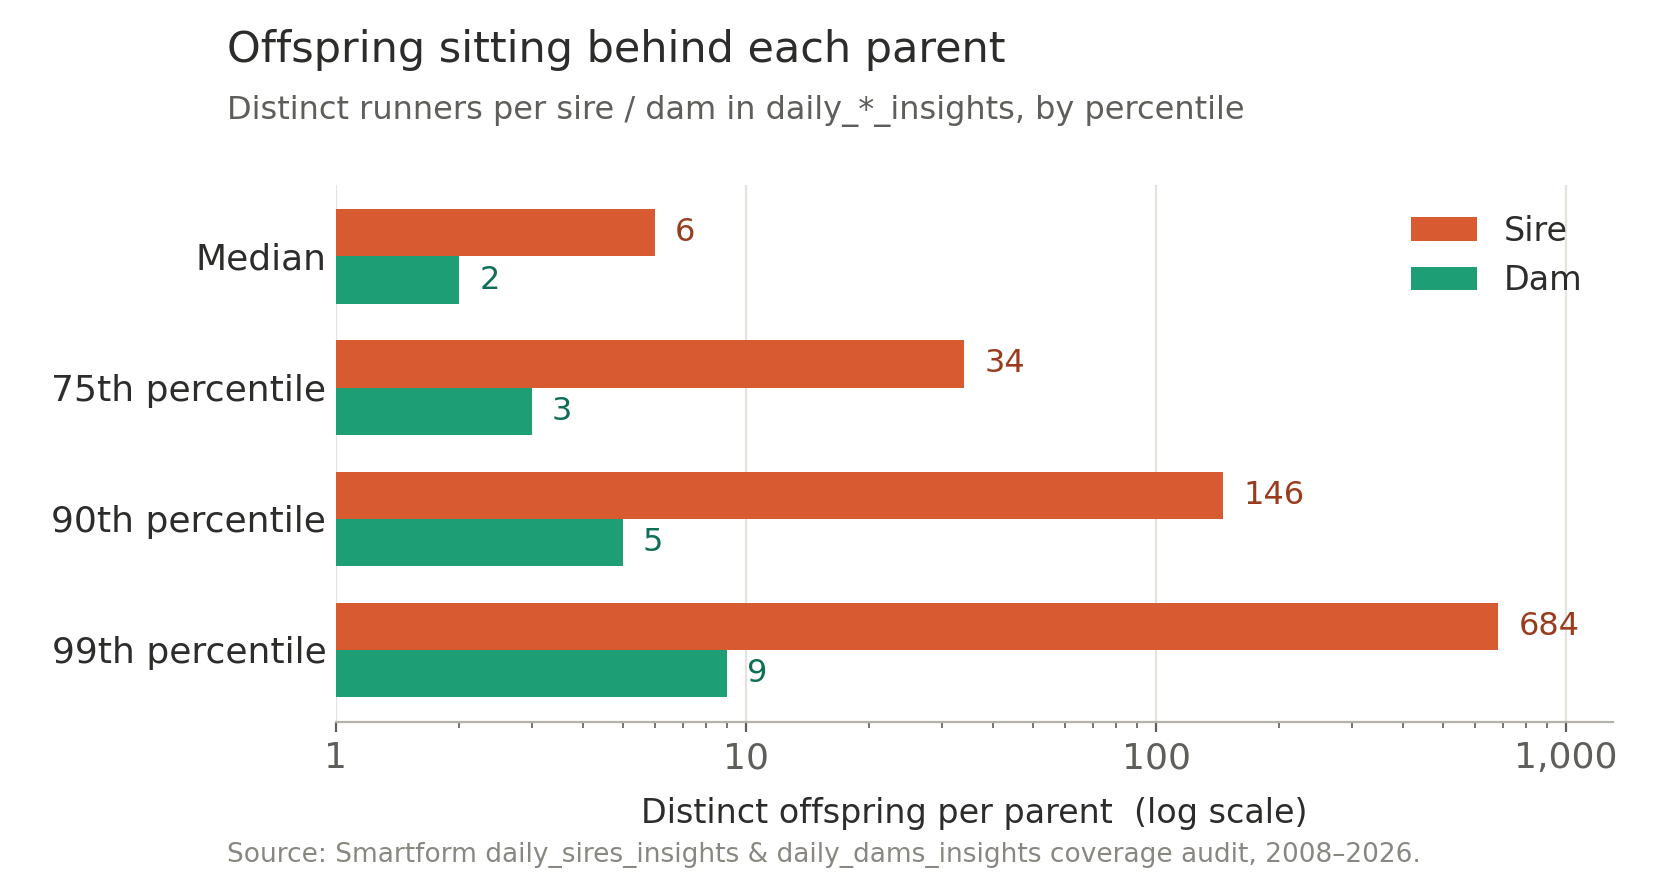
The median sire has 6 offspring in our data; the median dam has 2. The busiest sires reach several hundred; the busiest dams, single figures.
That asymmetry carries through to the sample size behind any individual stat you query. For sires, around 90% of rows rest on 51 or more prior progeny runs at the race type. For dams, that figure is 5%, and most rows sit on a handful of runs.
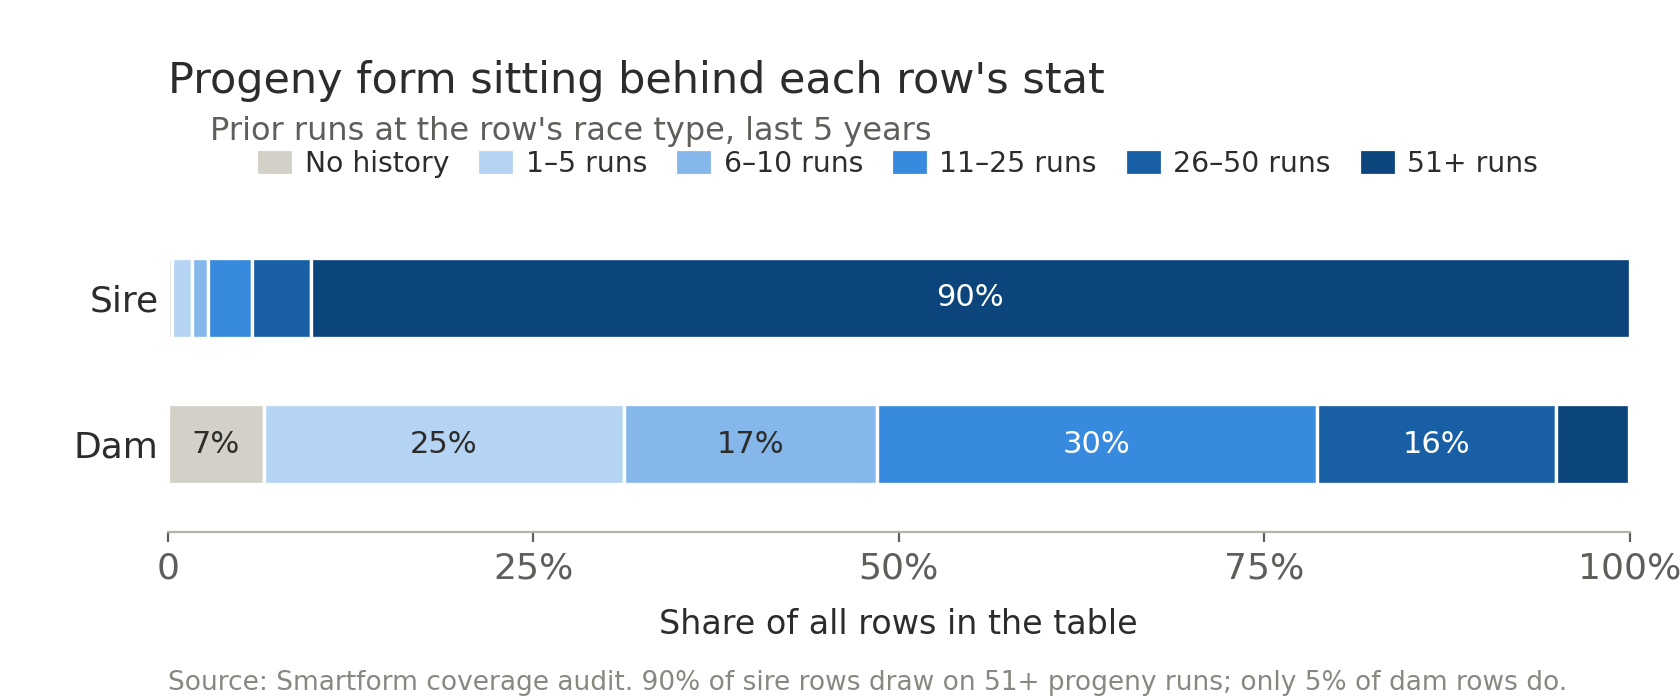
For dams, about 6.5% of rows have no prior history at the exact race type, and roughly a third have five or fewer prior runs to aggregate over.
The practical reading: dam stats are most informative when the dam has multi-offspring history and you stay at the broader race-code level (Flat vs Jumps), where 96.7% of rows have some history and the median row aggregates over 11–25 prior runs. The very specific stats — race-type and course and distance — are sparse enough that you should weight them lightly. A handy guardrail is already in the data: roughly 13% of rows describe a dam whose only progeny in our records is the runner itself, so the dam stat there simply re-states the horse’s own form and adds nothing new. Filter those out with the runs fields and you’re left with genuine sibling signal.
For the record: coverage runs from 2008 across all five UK & Irish race types (Chase, Hurdle, Flat, National Hunt Flat and All-Weather Flat), totalling 2,421,827 rows over 71,684 distinct dams, with dam_id resolved on 99.95% of runners.
Why today, of all days
This isn’t a coincidental release date. Tomorrow brings the Oaks and then on Saturday the Derby – two Classics run over the same 1m4f at Epsom, and two of the best possible test cases for what a maternal-line signal can and can’t do at the very top of the sport.
Our next post – out before racing starts – puts the table straight to work: what the dam data says about past Derby and Oaks trends, and why the two Classics turn out to reward very different reads of a pedigree. It’s a good illustration of using the table in anger.
Get started
Smartform subscribers can download daily_dams_insights now from the downloads section of the site once logged in. (Not yet a subscriber? You’ll need a Smartform subscription first.) Once you’ve installed it, smartform-updater keeps the table current automatically through the standard loaded_at mechanism — exactly as it does your existing tables, with no change to your workflow.
A couple of queries to get going:
-- Today's runners, ranked by their dam's 5-year prior race-type strike rate
SELECT race_id, runner_id, dam_name, rt_5Y_strike_rate, rt_5Y_runs
FROM   daily_dams_insights
WHERE  meeting_date = CURDATE()
ORDER  BY rt_5Y_strike_rate DESC;

-- Dams whose other foals have run today's distance well, with enough runs to trust
SELECT runner_id, dam_name, rt_5Y_distance_prb, rt_5Y_distance_runs
FROM   daily_dams_insights
WHERE  meeting_date = CURDATE()
  AND  rt_5Y_distance_prb  > 65
  AND  rt_5Y_distance_runs >= 5
ORDER  BY rt_5Y_distance_prb DESC;
Full schema and field-level descriptions are linked from the daily_dams_insights page and your Smartform admin area.
As always, questions or suggestions to the usual address. The dam-side breeding signal hasn’t been systematically queryable before now, and we expect you’ll turn up patterns we haven’t looked at yet.
Enjoy!
— Betwise / Smartform