
Loops With R – Creating a Racecard with Trainer and Jockey Stats
By Phill Clarke on Tuesday, June 19th, 2018Yesterday we looked at how to create a function in order to easily run the same set of code multiple times, without having to manually edit the code every time. While this is a highly useful concept to understand, we’re still left with manually applying the trainer and jockey combinations for each runner. It remains a time consuming task. Therefore, this article covers creating a basic for loop to iterate over the rows of a dataframe and apply a function to each of them.
There are many ways to loop over the rows of a dataframe, list or matrix in R. Some methods are more efficient than others, while some are perhaps more logical than others. Specifically this article demonstrates how to apply a for loop, which rightly receives some criticism for being slow to execute in certain circumstances. For our purposes, with a limited number of rows, this will not be a problem. However, the reader should investigate R’s apply family of functions and also the map function in the purrr library.
The full R code will be provided within the article, as there have been some useful changes made to code used previously. The complete code will also, as usual, be provided at the end of this article.
Begin by returning historic racing results, this time since 2013 for a full five year dataset and also from tomorrow’s race card:
# Load the library packages
library("RMySQL")
library("dplyr")

# Connect to the Smartform database. Substitute the placeholder credentials for your own.
# The IP address can be substituted for a remote location if appropriate.
con <- dbConnect(MySQL(),
                 host='127.0.0.1',
                 user='yourusername',
                 password='yourpassword',
                 dbname='smartform')

# Select relevant historic results
sql1 <- paste("SELECT historic_races.course,
              historic_races.meeting_date,
              historic_races.conditions,
              historic_races.group_race,
              historic_races.race_type_id,
              historic_races.race_type,
              historic_runners.name,
              historic_runners.jockey_name,
              historic_runners.trainer_name,
              historic_runners.finish_position,
              historic_runners.starting_price_decimal
              FROM smartform.historic_runners
              JOIN smartform.historic_races USING (race_id)
              WHERE historic_races.meeting_date >= '2012-01-01'", sep="")

smartform_results <- dbGetQuery(con, sql1)

# Select relevant daily results for tomorrow
sql2 <- paste("SELECT daily_races.course,
              daily_races.race_title,
              daily_races.meeting_date,
              daily_runners.cloth_number,
              daily_runners.name,
              daily_runners.trainer_name,
              daily_runners.jockey_name,
              daily_runners.forecast_price_decimal
              FROM smartform.daily_races
              JOIN smartform.daily_runners USING (race_id)
              WHERE daily_races.meeting_date >='2018-06-20'", sep="")

smartform_daily_results <- dbGetQuery(con, sql2)

dbDisconnect(con)
Next is the Trainer/Jockey function explained yesterday. However, the code will be broken into a few sections, as there have been some changes incorporated.
The function, as detailed previously:
# Name the function and add some arguments
tj <- function(race_filter = "", price_filter = 1000, trainer, jockey){

  # Filter for flat races only
  flat_races_only <- dplyr::filter(smartform_results,
                                   race_type_id == 12 |
                                     race_type_id == 15)

  # Add an if else statement for the race_filter argument
  if (race_filter == "group"){

    filtered_races <- dplyr::filter(flat_races_only,
                                    group_race == 1 |
                                      group_race == 2 |
                                      group_race == 3 )
  } else {

    filtered_races = flat_races_only
  }

  # Filter by trainer name
  trainer_filtered <- dplyr::filter(filtered_races,
                                    grepl(trainer, trainer_name))

  # Remove non-runners
  trainer_name_filtered <- dplyr::filter(trainer_filtered, !is.na(finish_position))

  # Filter by jockey name
  trainer_jockey_filtered <- dplyr::filter(trainer_filtered,
                                           grepl(jockey, jockey_name))

  # Filter by price
  trainer_jockey_price_filtered <- dplyr::filter(trainer_jockey_filtered,
                                                 starting_price_decimal <= price_filter)

  #  Calculate Profit and Loss
  trainer_jockey_cumulative <- cumsum(
    ifelse(trainer_jockey_price_filtered$finish_position == 1,
           (trainer_jockey_price_filtered$starting_price_decimal-1),
           -1)
  )

  # Calculate Strike Rate
  winners <- nrow(dplyr::filter(trainer_jockey_price_filtered,
                                finish_position == 1))

  runners <- nrow(trainer_jockey_price_filtered)

  strike_rate <- (winners / runners) * 100

  # Calculate Profit on Turnover or Yield
  profit_on_turnover <- (tail(trainer_jockey_cumulative, n=1) / runners) * 100

  # Check if POT is zero length to catch later errors
  if (length(profit_on_turnover) == 0) profit_on_turnover <- 0
The last line above is new. This line is being used to catch any instances where the profit on turnover figure is of zero length. That means that the calculation has not been successful, usually because there were no runners for the combination of trainer and jockey.
Continuing with the function:
  # Calculate Impact Values
  # First filter all runners by price, to return those just starting at the price_filter or less
  all_runners <- nrow(dplyr::filter(filtered_races,
                                    starting_price_decimal <= price_filter))

  # Filter all winners by the price filter
  all_winners <- nrow(dplyr::filter(filtered_races,
                                    finish_position == 1 &
                                      starting_price_decimal <= price_filter))

  # Now calculate the Impact Value
  iv <- (winners / all_winners) / (runners / all_runners)

  # Calculate Actual vs Expected ratio
  # # Convert all decimal odds to probabilities
  total_sp <- sum(1/trainer_jockey_price_filtered$starting_price_decimal)

  # Calculate A/E by dividing the number of  winners, by the sum of all SP probabilities.
  ae <- winners / total_sp

  # Calculate Archie
  archie <- (runners * (winners  - total_sp)^2)/ (total_sp  * (runners - total_sp))

  # Calculate the Confidence figure
  conf <- pchisq(archie, df = 1)*100

  # Create an empty variable
  trainer_jockey <- NULL

  # Add all calculated figures as named objects to the variable, which creates a list
  trainer_jockey$tj_runners <- runners
  trainer_jockey$tj_winners <- winners
  trainer_jockey$tj_sr <- strike_rate
  trainer_jockey$tj_pot <- profit_on_turnover
  trainer_jockey$tj_iv <- iv
  trainer_jockey$tj_ae <- ae
  trainer_jockey$tj_conf <- conf

  # Add an error check to convert all NaN values to zero
  final_results <- unlist(trainer_jockey)
  final_results[ is.nan(final_results) ] <- 0

  # Manipulate the layout of returned results to be a nice dataframe
  final_results <- t(as.data.frame(final_results))
  rownames(final_results) <- c()

  # 2 decimal places only
  round(final_results, 2)

  # Finally, close the function
}
Once again, there are some new lines in the final part of the function above. The results are checked for NaN values, which again occur if a calculation has failed. It is not possible, for example, to calculate strike rate if there are no runners for the trainer and jockey combination. Error checking such as this will take some time to implement, but does save a lot of headaches later.
The results are then transformed, with t from a long to wide dataframe, the rownames are removed and all results rounded to two decimal places.
Now, we move on to the new section for this article. First, filter the current daily races for Group races only and also create an empty placeholder list.
# Filter tomorrow's races for Group races only
group_races_only <- dplyr::filter(smartform_daily_results,
                                  grepl(paste(c("Group 1", "Group 2", "Group 3"), collapse="|"), race_title))

# Create a placeholder list which will be required later
row <- list()
Then start the for loop, which essentially says for every value of name, which is the column containing the horse’s name, apply the code which follows. This code includes extracing the trainer and jockey names, then executing the function defined earlier. Lastly, the data is iteratively added to the emtpy list and converted to a dataframe.
# Setup the loop
# For each horse in the group_races_only dataframe
for (i in group_races_only$name) {

  runner_details = group_races_only[group_races_only$name==i,]

  # Extract trainer and jockey names
  trainer = runner_details$trainer_name
  jockey = runner_details$jockey_name

  # Apply the Trainer/Jockey function for Group races only
  trainer_jockey_combo <- tj(race_filter = "group",
                             trainer = trainer,
                             jockey = jockey)

  # Add results row by row to the previously defined list
  row[[i]] <- trainer_jockey_combo

  # Create a final dataframe
  stats_final <- as.data.frame(do.call("rbind", row))

}
As a final piece of code, we bind the new data and the general racing data from the Smartform database in a new variable called racecard. Viewing this racecard will now display the strike rate, profit on turnover, impact value, actual vs expected and confidence figure for every jockey and trainer combination in Group races on tomorrow’s race card. They are of course all at Royal Ascot.
# Create a new variable called racecard. Bind together the generic race details with the newly created stats
racecard <- cbind(group_races_only,stats_final)
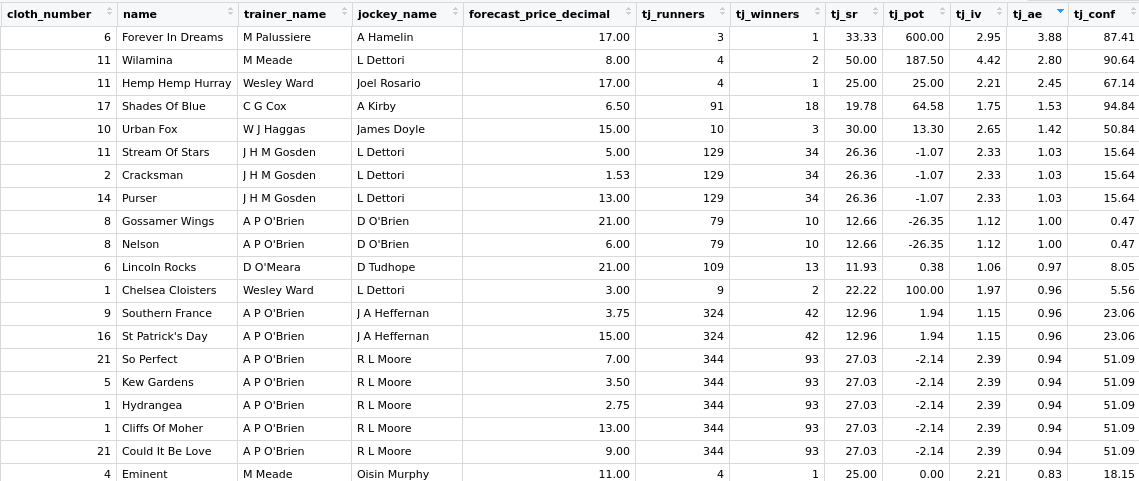
This data can now be reviewed for interesting angles. The screenshot below displays the data ordered descending from the highest A/E value. The first thing to notice about the top three entries is the very small sample size, with only three of four runs. However, the fourth entry for Cox and Kirby does have a robust sample size and some very good figures. Shades of Blue in the Queen Mary Stakes tomorrow at Royal Ascot is certainly worth a closer look. As are the Gosden and Dettori trio of Stream of Stars, Cracksman and Purser. This combination already struck three times today with Calyx, Without Parole and Monarch’s Glen.
Good luck!
Questions and queries about this article should be posted as a comment below or on the Betwise Q&A board.
The full R code used in this article is found below.
# Load the library packages
library("RMySQL")
library("dplyr")

# Connect to the Smartform database. Substitute the placeholder credentials for your own.
# The IP address can be substituted for a remote location if appropriate.
con <- dbConnect(MySQL(),
                 host='127.0.0.1',
                 user='yourusername',
                 password='yourpassword',
                 dbname='smartform')

# Select relevant historic results
sql1 <- paste("SELECT historic_races.course,
              historic_races.meeting_date,
              historic_races.conditions,
              historic_races.group_race,
              historic_races.race_type_id,
              historic_races.race_type,
              historic_runners.name,
              historic_runners.jockey_name,
              historic_runners.trainer_name,
              historic_runners.finish_position,
              historic_runners.starting_price_decimal
              FROM smartform.historic_runners
              JOIN smartform.historic_races USING (race_id)
              WHERE historic_races.meeting_date >= '2012-01-01'", sep="")

smartform_results <- dbGetQuery(con, sql1)

# Select relevant daily results for tomorrow
sql2 <- paste("SELECT daily_races.course,
              daily_races.race_title,
              daily_races.meeting_date,
              daily_runners.cloth_number,
              daily_runners.name,
              daily_runners.trainer_name,
              daily_runners.jockey_name,
              daily_runners.forecast_price_decimal
              FROM smartform.daily_races
              JOIN smartform.daily_runners USING (race_id)
              WHERE daily_races.meeting_date >='2018-06-20'", sep="")

smartform_daily_results <- dbGetQuery(con, sql2)

dbDisconnect(con)

# Name the function and add some arguments
tj <- function(race_filter = "", price_filter = 1000, trainer, jockey){

  # Filter for flat races only
  flat_races_only <- dplyr::filter(smartform_results,
                                   race_type_id == 12 |
                                     race_type_id == 15)

  # Add an if else statement for the race_filter argument
  if (race_filter == "group"){

    filtered_races <- dplyr::filter(flat_races_only,
                                    group_race == 1 |
                                      group_race == 2 |
                                      group_race == 3 )
  } else {

    filtered_races = flat_races_only
  }

  # Filter by trainer name
  trainer_filtered <- dplyr::filter(filtered_races,
                                    grepl(trainer, trainer_name))

  # Remove non-runners
  trainer_name_filtered <- dplyr::filter(trainer_filtered, !is.na(finish_position))

  # Filter by jockey name
  trainer_jockey_filtered <- dplyr::filter(trainer_filtered,
                                           grepl(jockey, jockey_name))

  # Filter by price
  trainer_jockey_price_filtered <- dplyr::filter(trainer_jockey_filtered,
                                                 starting_price_decimal <= price_filter)

  #  Calculate Profit and Loss
  trainer_jockey_cumulative <- cumsum(
    ifelse(trainer_jockey_price_filtered$finish_position == 1,
           (trainer_jockey_price_filtered$starting_price_decimal-1),
           -1)
  )

  # Calculate Strike Rate
  winners <- nrow(dplyr::filter(trainer_jockey_price_filtered,
                                finish_position == 1))

  runners <- nrow(trainer_jockey_price_filtered)

  strike_rate <- (winners / runners) * 100

  # Calculate Profit on Turnover or Yield
  profit_on_turnover <- (tail(trainer_jockey_cumulative, n=1) / runners) * 100

  # Check if POT is zero length to catch later errors
  if (length(profit_on_turnover) == 0) profit_on_turnover <- 0

  # Calculate Impact Values
  # First filter all runners by price, to return those just starting at the price_filter or less
  all_runners <- nrow(dplyr::filter(filtered_races,
                                    starting_price_decimal <= price_filter))

  # Filter all winners by the price filter
  all_winners <- nrow(dplyr::filter(filtered_races,
                                    finish_position == 1 &
                                      starting_price_decimal <= price_filter))

  # Now calculate the Impact Value
  iv <- (winners / all_winners) / (runners / all_runners)

  # Calculate Actual vs Expected ratio
  # # Convert all decimal odds to probabilities
  total_sp <- sum(1/trainer_jockey_price_filtered$starting_price_decimal)

  # Calculate A/E by dividing the number of  winners, by the sum of all SP probabilities.
  ae <- winners / total_sp

  # Calculate Archie
  archie <- (runners * (winners  - total_sp)^2)/ (total_sp  * (runners - total_sp))

  # Calculate the Confidence figure
  conf <- pchisq(archie, df = 1)*100

  # Create an empty variable
  trainer_jockey <- NULL

  # Add all calculated figures as named objects to the variable, which creates a list
  trainer_jockey$tj_runners <- runners
  trainer_jockey$tj_winners <- winners
  trainer_jockey$tj_sr <- strike_rate
  trainer_jockey$tj_pot <- profit_on_turnover
  trainer_jockey$tj_iv <- iv
  trainer_jockey$tj_ae <- ae
  trainer_jockey$tj_conf <- conf

  # Add an error check to convert all NaN values to zero
  final_results <- unlist(trainer_jockey)
  final_results[ is.nan(final_results) ] <- 0

  # Manipulate the layout of returned results to be a nice dataframe
  final_results <- t(as.data.frame(final_results))
  rownames(final_results) <- c()

  # 2 decimal places only
  round(final_results, 2)

  # Finally, close the function
}

# Filter tomorrow's races for Group races only
group_races_only <- dplyr::filter(smartform_daily_results,
                                  grepl(paste(c("Group 1", "Group 2", "Group 3"), collapse="|"), race_title))

# Create a placeholder list which will be required later
row <- list()

# Setup the loop
# For each horse in the group_races_only dataframe
for (i in group_races_only$name) {


  runner_details = group_races_only[group_races_only$name==i,]

  # Extract trainer and jockey names
  trainer = runner_details$trainer_name
  jockey = runner_details$jockey_name

  # Apply the Trainer/Jockey function for Group races only
  trainer_jockey_combo <- tj(race_filter = "group",
                             trainer = trainer,
                             jockey = jockey)

  # Add results row by row to the previously defined list
  row[[i]] <- trainer_jockey_combo

  # Create a final dataframe
  stats_final <- as.data.frame(do.call("rbind", row))

}

# Create a new variable called racecard. Bind together the generic race details with the newly created stats
racecard <- cbind(group_races_only,stats_final)