
Making use of Days Since Last Run
By Henry Young on Thursday, March 31st, 2022I have learned the hard way that a quick turnaround is a red flag for laying. Trainers will sometimes run a horse again only a few days after a much improved run or a win. They do this to capitalize on a horse coming into form, especially in handicaps to beat the handicapper reassessment delay. But how can we quantify the impact of this phenomenon, whether for use in a custom racecard analysis or for feeding into a machine learning (ML) system.
Smartform contains a field “days_since_ran” in both daily_runners and historic_runners tables. However, seeing that a runner last ran x days ago does not really tell you much other than a little of what’s in the trainer’s mind. And this data point is completely unsuitable for passing on to ML because it is not normalized. The easiest solution is to convert it into a Strike Rate percentage:
Strike Rate = Number of wins / Number of races
We need to count races, count wins and calculate Strike Rate percentages. This can be done in SQL as follows:
SELECT
    sub.days_since_ran,
    sub.race_count,
    sub.win_count,
    round(sub.win_count / sub.race_count * 100, 1) AS strike_rate
FROM (
    SELECT
        days_since_ran,
        COUNT(*) as race_count,
        COUNT(IF(finish_position = 1, 1, NULL)) AS win_count
    FROM
        historic_runners_beta
    JOIN
        historic_races_beta
    USING(race_id)
    WHERE
        days_since_ran IS NOT NULL AND
        year(meeting_date) >= 2010
    GROUP BY days_since_ran
    ORDER BY days_since_ran LIMIT 50) AS sub;
You can see a neat trick for counting wins in line 10.
This is structured as a nested query because the inner SELECT does the counting with runners grouped by days_since_ran, while the outer SELECT calculates percentages using the counted totals per group. I find myself using this nested query approach frequently – counting in the inner and calculating in the outer.
The first 15 lines of the resulting table looks like this:
+----------------+------------+-----------+-------------+
| days_since_ran | race_count | win_count | strike_rate |
+----------------+------------+-----------+-------------+
|              1 |       5051 |       210 |         4.2 |
|              2 |       7250 |       566 |         7.8 |
|              3 |       7839 |       988 |        12.6 |
|              4 |      10054 |      1397 |        13.9 |
|              5 |      13139 |      1705 |        13.0 |
|              6 |      17978 |      2176 |        12.1 |
|              7 |      34955 |      3892 |        11.1 |
|              8 |      29427 |      3064 |        10.4 |
|              9 |      31523 |      3174 |        10.1 |
|             10 |      33727 |      3242 |         9.6 |
|             11 |      36690 |      3411 |         9.3 |
|             12 |      39793 |      3854 |         9.7 |
|             13 |      42884 |      4039 |         9.4 |
|             14 |      61825 |      5771 |         9.3 |
|             15 |      44634 |      4303 |         9.6 |
Here we can see that Strike Rate has an interesting peak around 3-7 days since last run. But is this the same for handicaps and non-handicaps ? We can answer that question easily by adding an extra WHERE clause to slice and dice the data. We insert this after the WHERE on line 16:
handicap = 1 ANDrerun the SQL then switch it to:
handicap = 0 ANDand run it again.
We can then paste the output into three text files, import each into Excel, and turn it into a chart:
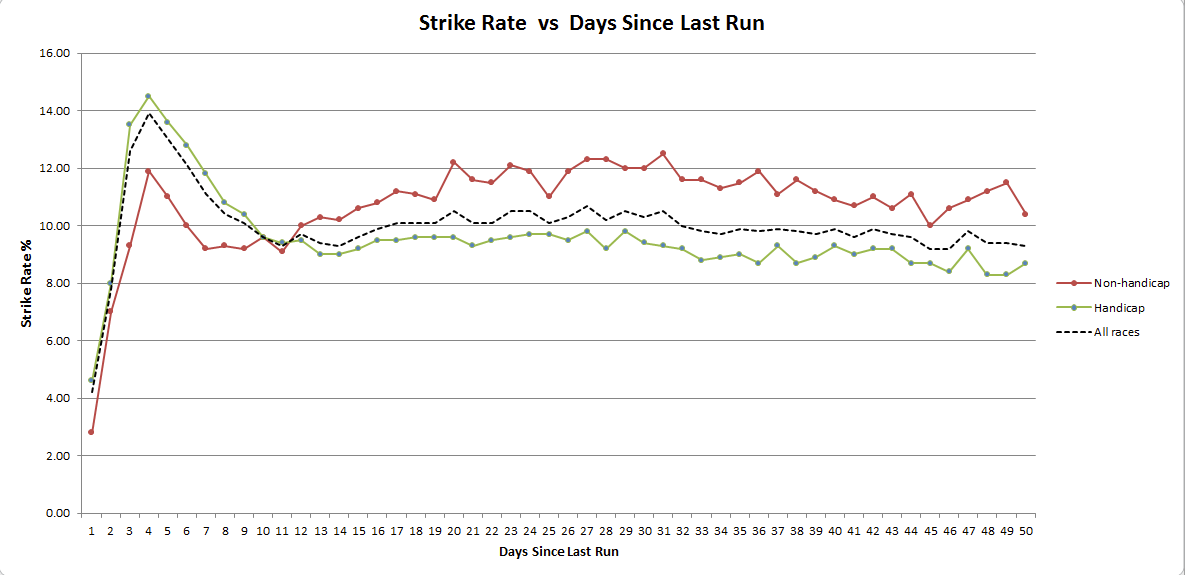
We can see that the quick turnaround Strike Rate peak is most pronounced in handicaps. But for non-handicaps the notable feature is really a lowering of Strike Rate in the 7-14 day range. It’s also interesting to see that handicaps generally have a lower Strike Rate than non-handicaps, perhaps due to field size trends. And as you would expect, running within one or two days of a prior run is rarely a good idea !
But there’s an even better way to structure a query to return the data for all races, handicaps and non-handicaps by adding the handicap field to both SELECT clauses and the GROUP BY with a ROLLUP for good measure:
SELECT
    sub.days_since_ran,
    sub.handicap,
    sub.race_count,
    sub.win_count,
    round(sub.win_count / sub.race_count * 100, 1) AS strike_rate
FROM (
    SELECT
        days_since_ran,
        handicap,
        COUNT(*) as race_count,
        COUNT(IF(finish_position = 1, 1, NULL)) AS win_count
    FROM
        historic_runners_beta
    JOIN
        historic_races_beta
    USING(race_id)
    WHERE
        days_since_ran IS NOT NULL AND
        year(meeting_date) >= 2010
    GROUP BY days_since_ran, handicap WITH ROLLUP
    ORDER BY days_since_ran, handicap LIMIT 150) AS sub;
The first 15 lines of the resulting table looks like this:
+----------------+----------+------------+-----------+-------------+
| days_since_ran | handicap | race_count | win_count | strike_rate |
+----------------+----------+------------+-----------+-------------+
|           NULL |     NULL |    1496886 |    145734 |         9.7 |
|              1 |     NULL |       5051 |       210 |         4.2 |
|              1 |        0 |       1292 |        36 |         2.8 |
|              1 |        1 |       3759 |       174 |         4.6 |
|              2 |     NULL |       7250 |       566 |         7.8 |
|              2 |        0 |       1580 |       110 |         7.0 |
|              2 |        1 |       5670 |       456 |         8.0 |
|              3 |     NULL |       7839 |       988 |        12.6 |
|              3 |        0 |       1671 |       155 |         9.3 |
|              3 |        1 |       6168 |       833 |        13.5 |
|              4 |     NULL |      10054 |      1397 |        13.9 |
|              4 |        0 |       2300 |       274 |        11.9 |
|              4 |        1 |       7754 |      1123 |        14.5 |
|              5 |     NULL |      13140 |      1705 |        13.0 |
|              5 |        0 |       3101 |       341 |        11.0 |
|              5 |        1 |      10039 |      1364 |        13.6 |
where the rows with handicap = NULL represent the All Races data. While this is less convenient for importing into Excel to make a chart, it is closer to what you may want as a data mapping table for normalizing data to be passed onto a ML system. The top double NULL row gives the Strike Rate for all runners in all races of all types irrespective of days_since_ran as 9.7% – a useful baseline number.
A question for the reader. If the average Strike Rate for all runners in all races of all types is 9.7%, can you use that information to calculate the average number of runners per race ? And what simple one liner query would you use to check your result ? Answers in the comments please 🙂
The final point to tie up is what if you want to use this as a days_since_ran to Strike Rate conversion so that you can present normalized data to your downstream ML system. The simplest solution is to store this data back into the database as a data mapping table by prefixing the outer SELECT with:
DROP TABLE IF EXISTS days_since_ran_x_strike_rate;
CREATE TABLE days_since_ran_x_strike_rate(
    days_since_ran   int(4),
    handicap         tinyint(1),
    race_count       int(6),
    win_count        int(6),
    strike_rate      decimal(4,1));
INSERT INTO days_since_ran_x_strike_rate
SELECT
   ...
You can then use this data mapping table for days_since_ran to Strike Rate conversion by performing a JOIN as follows (incomplete code):
SELECT
    strike_rate
FROM
    daily_runners
JOIN
    days_since_ran_x_strike_rate
USING(days_since_ran)
To make this work reliably is a little more complex because once over 50 days you need to bucket day ranges or perhaps have a single bucket for > 50 with the LIMIT 50 removed, which in turn means working CASE into your SQL.
For automation, you can set the whole thing up as a stored procedure which you run daily as a Windows scheduled job or Linux cron job, shortly after your daily database update.
Ah the joys of burning the midnight oil with statistics! I remember it well! Luckily I’m past it now and have left it behind. I had a system that possibly still works. Based on the data in this article.
i.e.
Any all-weather handicap winner running again before being handicapped again – carrying stipulated extra weight. which had either won the last run with a comment given of ‘Comfortably’ or ‘Easily’ or had won by 5 lengths or more. Which is now favorite or second favorite up to a price of 9/2, or had won its last two races.
God knows what the statistics are!
I generally found it too infrequent on qualifiers so dropped it. But have seen occasional winners.
Michael age 85 Birmingham
Certainly you can define criteria for a profitable system, but then you find it triggers infrequently. So you either accept a broader set of criteria for a lower strike rate, or rack up multiple highly targeted systems. Either way it is an endlessly fascinating game. The new frontier however is automating or systematizing system discovery. That is something that Smartform is exceptionally suitable for as the initial data source.